A report setting out our pathway to achieving our 2030 net zero goals and reducing our operational emissions.
Published: 28 March 2024
CEO introduction
2023 was the hottest year on record. High temperatures caused heatwaves, floods and wildfires in different corners of the world.
The science tells us beyond refute that fossil fuels and other human activities are heating up the planet. It is up to all of us to act now and radically change how we operate as businesses and societies.
The world is responding to the climate challenge and pension schemes are at the forefront – with trustees identifying, assessing and managing climate-related risks and opportunities, and adjusting investment strategies so that members' best interests are met in the long-term.
As a business, The Pensions Regulator (TPR) is on the same journey as many others across the world in transitioning to net zero. In 2021, we launched our Climate Change Strategy, setting out not only how we would help our market manage the transition but also how we would lead from the front in cutting our carbon emissions.
Our net zero goals are clear. First, a 2030 operational net zero goal against the emissions we have most control over, namely gas, electricity, waste, business travel and water. Second, a 2050 science-based net zero goal against all of our operational emissions. Both targets will deliver a minimum 90% reduction. This net zero plan sets out our practical pathway to achieving these goals. We will have to change the way we operate and make decisions with our impact on the environment – and impact on the economy as a result – in mind in everything that we do.
This plan is just the start. As a regulator, our job is to protect, enhance and innovate in savers' interests. By playing our role in the fight against the harm caused by climate change, we can do all three.


Nausicaa Delfas, Chief Executive
Executive summary
In April 2021, we published our Climate Change Strategy which established three mains aims, the third of which sets out that we will, as a business, take part in the transition to net zero.
The strategy also set out objectives that detail how we would deliver on the three aims, with the sixth objective being that we "will set a 2030 net zero carbon emissions target for TPR and by 2024 we will set out our plans to achieve this".
The net zero plan set out here establishes the accuracy of our carbon emissions to date, the baseline years we are measuring our net zero targets against, the emissions categories included, and the interventions required for successful delivery of net zero by 2030.
However, it also recognises that there are gaps – namely in relation to emissions arising from our value chain. We have intentionally omitted some of these emissions from our 2030 target due to the great difficulty in delivering sufficient reductions by 2030. For that reason, we have also set a secondary net zero target for 2050, which covers all of our operational emissions.
We are committing to reducing our operational emissions in relation to gas, electricity, business travel, water and waste by at least 90% by 2030, purchasing carbon credits to offset the residual emissions remaining.
In addition, we are committing to reducing all operational emissions, including those arising from our supply chain and employee commuting, by at least 90% by 2050, again offsetting the remainder. This aligns us to a science-based approach, which seeks to avoid the worst effects of climate change.
This approach aligns us to UK government policy and we believe represents the most realistic way to effectively tackle all our greenhouse gas emissions.
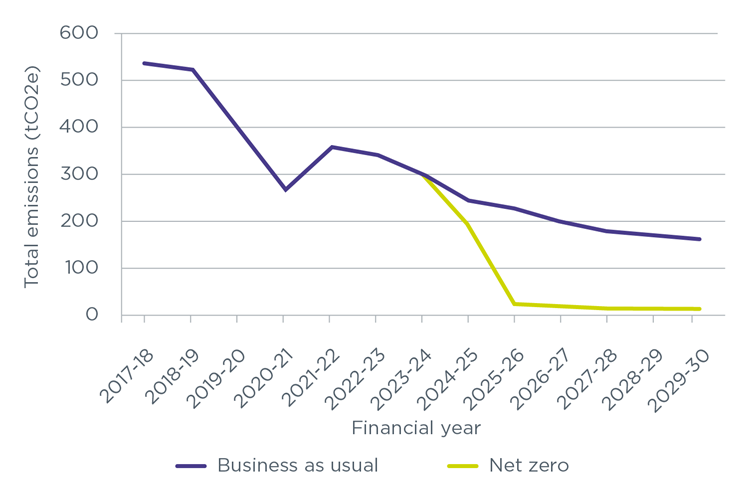
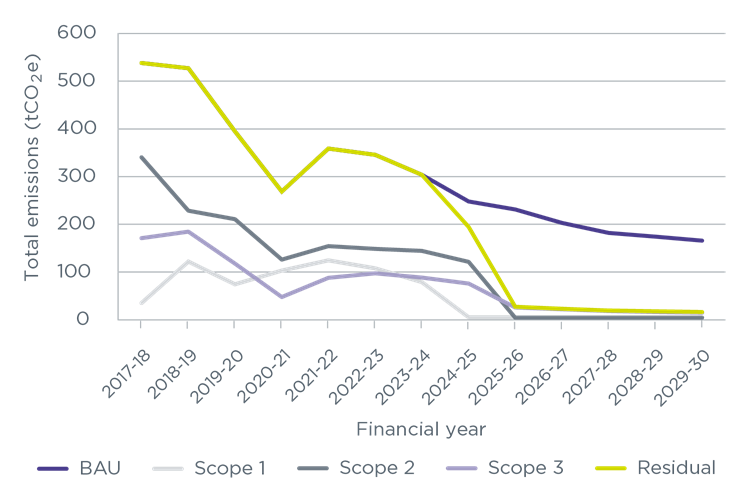
Figure 1 below sets out our historical and projected greenhouse gas emissions in scope for our 2030 target. From 2023 to 2024, the divergence is shown between our projected emissions if we were to do nothing (business as usual) and the reductions brought about by the interventions set out here.
Figure 1: TPR net zero trajectory to 2030
Alignment, benchmarking and integration
Alignment to national and international sustainability strategy
We protect workplace pensions within the UK, aiming to drive up standards and enable safe saving for retirement. We have around 1,000 employees, conducting mainly desk-based work. Our operating model comprises a hybrid model of home and office-based working. We are located in a single office in Brighton where we occupy one and a half floors of shared tenancy office space with capacity for 330 people.
We are sponsored by the Department for Work and Pensions (DWP). As a public body, we have committed to take part in the UK government's transition to a net zero emissions economy by 2050. We have sought to align our approach to achieving net zero with the existing national and international strategies and initiatives that support this transition. Given the size and nature of our operations, not all will apply in their entirety. It should also be noted that the below list is not exhaustive but is representative of what we have identified as the most relevant to our circumstance.
There is a difficult balance to be struck in communicating such alignment. We do not wish to be 'greenwashing' and making bold claims relating to our positive impact on the environment that are without basis. Similarly, we do not wish to be 'green hushing', saying nothing on important issues relating to environmental sustainability for fear of criticism. We have therefore sought to be as forthright as possible, outlining both what we believe is applicable and where our limitations lie.
Greening Government Commitments (GGCs)
The GGCs set out the actions that UK government departments and their agencies must take to reduce their environmental impacts.
The current greening government commitments relate to the period 2021 to 2025 and cover a range of environmental impacts. The headline target in relation to emissions is to "reduce the overall greenhouse gas emissions from a 2017 to 2018 baseline and also reduce direct greenhouse gas emissions from estate and operations from a 2017 to 2018 baseline".
We provide quarterly data on these commitments to the DWP. The DWP's targets are outlined in their carbon and water sustainability plans and include an overall target of 45% emissions reduction and a target of 17% reduction in direct emissions, across their estate, from 2017 to 2018 and 2024 to 2025. The complete set of targets that the DWP must reach by 2025 are outlined in the GGCs.
As outlined above, the current GGC reporting period is 2021 to 2025. It is likely that the framework will be reviewed before 2025 and therefore targets may be updated.
Net zero strategy
The UK government's net zero strategy was published in October 2021. It sets out the roadmap to delivering the UK's legal carbon reduction figures, culminating in a 2050 target of net zero. The strategy sets out how net zero must become embedded in government, stating "the way the government operates must rise to meet this challenge", which means "reducing the public sector's own carbon footprint".
Government Property Sustainability Strategy (GPSS)
Published in August 2022, the Government Property Strategy sets out three missions to transform the government estate. Mission 2 is to transition to a "smaller, better and greener public estate". The Government Property Sustainability Strategy was published a few months later and supports this mission through driving action to ensure that the public estate is:
- right sized to meet requirements
- safe, well-designed, well-maintained and accessible
- contributes to meeting net zero emissions
This net zero plan in particular addresses the final bullet point above, which in turn supports delivery of the UK government's net zero strategy.
UN Sustainable Development Goals (SDGs)
The SDGs were agreed in 2015 as part of the 2030 Agenda for Sustainable Development, representing a "shared blueprint for peace and prosperity for people and the planet, now and into the future". The 17 integrated SDGs aim to end poverty, improve health and education, reduce inequality and drive economic growth, while tackling climate change and preserving the natural environment.
While our net zero plan does not deliver on all 17 SDGs, it does take note of and endeavours to act upon five of them:
- SDG 11 - Sustainable cities and communities
- SDG 12 - Responsible production and consumption
- SDG 13 - Climate action
- SDG 14 - Life below water
- SDG 15 - Life on land
Science-Based Targets initiative (SBTi)
The SBTi is a global body that enables the private sector to tackle climate change while realising the opportunities from transitioning to a zero-carbon economy. The SBTi Net Zero Standard provides a framework for corporate net zero target setting in line with climate science. While the SBTi does not currently assess public bodies, they encourage such organisations to set their own science-based targets. To comply with SBTi criteria, an organisation with more than 500 employees must include all relevant greenhouse gases as required by the Green House Gas (GHG) Corporate Standard. The scope and coverage of the emissions target must include:
- Scope 1 emissions (direct emissions from owned or controlled sources, such as gas combustion in boilers)
- Scope 2 emissions (indirect emissions from the generation of purchased energy)
- Scope 3 emissions (indirect emissions, not included in Scope 2, that occur in the value chain) if they represent 40% or more of the total emissions inventory (Scope 1, 2 and 3 combined)
Companies must set a Scope 3 emission target that covers at least 67% of total Scope 3 emissions. As detailed in the Targets, baselines and scope section, while our 2030 target does not cover 67% of Scope 3 emissions, we have an ambition to meet an SBTi-aligned net zero target by 2050.
Benchmarking
As well as aligning to the previously outlined policies and frameworks, we also seek to align our approach with and measure it against other relevant organisations – namely our sponsor department the DWP, fellow regulator the Financial Conduct Authority (FCA) and the Pension Protection Fund (PPF), a statutory public corporation.
The net zero ambitions of these organisations, for the purposes of comparison to our own, are as follows:
- The DWP is working to meet DESNZ's cross-government Greening Government Commitments carbon targets, which align with the national net zero by 2050 target
- The FCA has set a 2045 net zero goal against all emissions including a 90% reduction in Scope 3 emissions
- The PPF has set a 2035 net zero goal against Scope 1, 2 and 3. Scope 3 targets relate to supply chain and travel emissions, with financed emissions from investments considered separately
Our net zero goals are:
- a 2030 operational net zero goal delivering a minimum 90% reduction against Scope 1, 2 and elements of Scope 3
- a 2050 net zero goal delivering a minimum 90% reduction against all emissions
Integration
This plan for delivering our net zero by 2030 target is part of a broader approach at TPR that encompasses how we deliver on sustainability as both a regulator and an organisation. In turn, the strategies and plans that reflect this broader approach will be aligned to and sit within a national and international strategic context relating to the work we do.
Corporate Strategy and plans
Our Corporate Strategy was published in March 2021, setting out our five strategic priorities. Each year we publish our Corporate Plan complementing the strategy, with the most recent published in April 2023, covering the period 2023 to 2024. While the Corporate Strategy recognises the risk posed by climate change, the most recent Corporate Plan covers climate-related risks and opportunities in detail including the delivery of our corporate net zero target.
Climate Change Strategy
Published in April 2021, our Climate Change Strategy establishes three aims. The first two are regulatory, and the third is organisational.
- We will create better outcomes in later life for workplace savers by driving trustee action on the risks and opportunities from climate change.
- We will seek to influence debates around pensions and climate change.
- We will, as a business, take part in the transition to net zero.
Delivery of aim three is vital if we are to maintain credibility as a regulator in relation to the first two aims of the strategy.
The current Climate Change Strategy takes us up to 2024. Work is underway to develop an updated and extended strategy which is due to be published in 2024 to 2025.
Climate adaptation report and Adaptation strategy
Our October 2021 Climate adaptation report sets out our approach to tackling the risks from climate change, both as a regulator and an organisation. This includes our corporate commitments to delivering our net zero target and reporting in line with recommendations outlined by the Taskforce on Climate-Related Financial Disclosures (TCFD). This aligns us to the wider pensions sector. We will be publishing a full Adaptation Strategy in 2024 to 2025.
TCFD and Annual Report and Accounts (ARA)
HM Treasury has set out a three-year phased approach to including TCFD recommendations in central government annual reports and accounts, with phase one of three applicable to reports relating to the 2023 to 2024 financial year. Therefore, within the sustainability section included in our ARA, we will be incorporating the elements of governance, metrics and targets as set out in the guidance, which will include our net zero target.
Transition Plan
The logical next step in mapping our corporate net zero journey is a Transition Plan which we aim to publish in 2025 to 2026. The difference between our net zero plan set out here and a Transition Plan is that the latter will expand upon the former. It will cover how we are committed to achieving a pathway that supports the 1.5 degree ambition of the Paris Agreement, while pivoting to align our business model to the challenges and opportunities of a net zero economy.
Targets, baselines and scope
Targets
While this plan sets out how we will reach operational net zero by 2030 against those emissions in scope, we have a secondary, science-based target of delivering net zero by 2050 against all material emissions, aligning us to a 1.5 degree scenario (Paris Agreement alignment). Our corporate ambition therefore is to follow best practice by delivering a target that supports keeping global warming in line with a 1.5 degree rise.
2030 baseline
We are required to align with and report on the GGCs, the headline target for which is to reduce emissions from a 2017 to 2018 baseline. We will adopt this same baseline year as a pre-COVID-19 representative year to measure our 2030 net zero target against, which aligns us with the GGCs.
2050 baseline
To conform to SBTi recommendations, we are proposing a different baseline using emissions data from the 2022 to2023 financial year for our 2050 science-based net zero target. The SBTi requirements state that all three emissions scopes should be represented in full, by way of accurate and verifiable data. For us, the 2022 to 2023 financial year is the first year we have been able to build a full profile of our entire emissions inventory.
Scope
The three emissions scopes across the value chain are detailed by the GHG Protocol. Figure 2 below illustrates a simplified version of these scopes to provide a context for those identified as material to TPR in the section below.
Figure 2: Scope 1, 2 and 3 emissions across the value chain
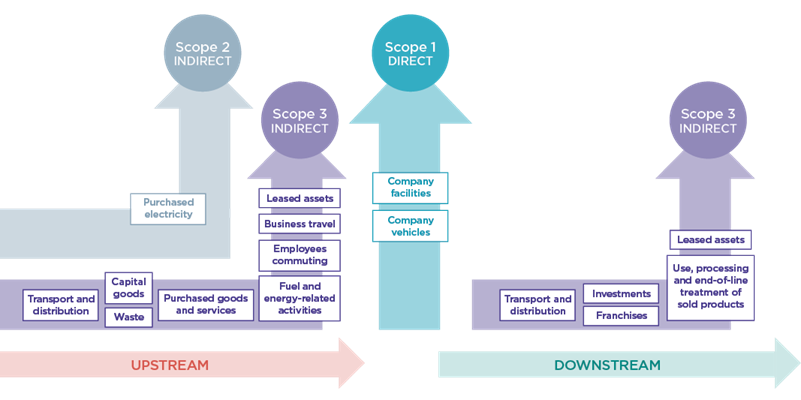
Scope 1 and 2 emissions
Emissions that we will measure under Scope 1 are:
- gas-fired central heating in our offices
- unintentional releases / leaks of refrigerant gases from air-conditioning units in our offices
The emissions source we will measure under Scope 2 is electricity used in our offices.
Scope 3 emissions
In order to determine which Scope 3 'value chain' emissions are relevant to us, criteria from the Greenhouse Gas Protocol Technical Guidance have been used and are detailed below.
- size – degree to which the emissions contribute to our total Scope 3 emissions
- influence – degree of influence we have over potential for reductions
- risk – degree to which the emissions contribute to our risk exposure
- stakeholders – degree to which the emissions are deemed critical by stakeholders
- sector guidance – degree to which the emissions have been identified as significant by sector-specific guidance
Using the above criteria, Scope 3 emissions that are material to us have been scored from 0 to 5, ranging from 'not applicable' (0), through 'negligible' (1), 'low', 'medium', 'high' and finally 'very high' (5). This then provides a total score for relevancy. The table below details which of the 15 Scope 3 categories are material to TPR.
Figure 3: table showing assessment of material Scope 3 emissions
| Category (number) | Category (description) | Size | Influence | Risk | Stakeholders | Sector guidance |
Relevance |
|---|---|---|---|---|---|---|---|
| 1 | Purchased goods and services | 5 | 3 | 4 | 4 | 4 | High |
| 2 | Capital goods | 4 | 3 | 4 | 4 | 4 | High |
| 3 | Fuel and energy related activities | 3 | 4 | 3 | 3 | 3 | Medium |
| 4 | Upstream transportation and distribution | 2 | 3 | 2 | 2 | 3 | Low |
| 5 | Waste generated in operations | 2 | 4 | 4 | 4 | 4 | Medium |
| 6 | Business travel | 2 | 4 | 4 | 4 | 4 | Medium |
| 7 | Employee commuting (including homeworking) | 2 | 4 | 2 | 2 | 3 | Medium |
| 8 | Upstream leased assets | 2 | 4 | 2 | 3 | 3 | Medium |
In summary, we have a net zero target for 2030 against a 2017 to 2018 baseline that will cover material Scope 1 and 2 emissions and elements of Scope 3 that go beyond the GGC requirements. We are also proposing a secondary 2050 science-based target against a 2022 to 2023 baseline that will cover all material emissions across all three scopes. This is set out below.
Figure 4: table showing summary of targets, baselines and scope
| Scope | Emissions source | 2030 target (2017 to 2018 baseline) | 2050 target (2022 to 2023 baseline) |
|---|---|---|---|
| 1 | Gas | X | X |
| Fugitive emissions | X | X | |
| 2 | Purchased electricity | X | X |
| 3 | Purchased goods and services | X (water only) | X (all) |
| Capital goods | X | ||
| Fuel and energy related activities | X | X | |
| Upstream transportation and distribution | X | ||
| Waste generated in operations | X | X | |
| Business travel | X | X | |
| Employee commuting (including homeworking) | X | ||
| Upstream leased assets | X |
The journey so far
Data collection
It is widely accepted that collecting sustainability data can be problematic. As such, rather than waiting for perfection, it is better to report what is possible using the data and tools available. If errors come to light through improvements to the data collection process, then retrospective correction is required.
We have been gathering data and reporting on environmental impacts for several years, but our established baseline year of 2017 to 2018 represents the point from which we have a representative and reasonably accurate dataset for gas, electricity, business travel and water.
In 2022, we commissioned consultants to audit and verify our sustainability data from 2017 up to 2022. As the final report was produced in March 2022, it was not possible to properly verify the fourth quarter of the 2021 to 2022 financial year (January to March 2022), so comparable proxy data was used.
In July 2023, we subsequently commissioned consultants to independently audit and verify the last two financial years of 2021 to 2022 and 2022 to 2023, while also reviewing our 2017 to 2018 data to ensure it reflected the latest reporting approach. This work was vital to ensure that we have a robust historic emissions profile against which future emissions and progress will be compared.
Assessment process
- definition of timeframes, operational boundaries and organisational boundaries
- review of the historical sustainability data provided by us
- analysis of the data following the accounting principles set out by the Greenhouse Gas Protocol, namely that:
- data accurately reflects our emissions
- the data collected is as complete as possible
- the data is comparable to other similar organisations
- there is transparency around the methodologies, reference data and assumptions
For step one in the assessment process, the following timeframes and boundaries were agreed and defined.
- Timeframe defined as 2021 to 2022 and 2022 to 2023 financial years.
- The organisational boundary includes any activity over which we have full authority to implement our own operating policies. We apply the operational control approach as per the Greenhouse Gas Protocol Corporate Standard.
- The operational boundary comprises operations associated with our leased office building. It is under a finance lease (as defined under IFRS16) meaning that that gas and electricity remains our Scope 1 and 2 respectively. Additionally, an assessment of relevant Scope 3 emissions was also included.
Data was provided by TPR in relation to the areas outlined below (marked 'X'). The gaps indicate where data was either not collected at the time and / or is currently not available. Note that data for 2017 to 2018 was not verified fully as this work had been previously carried out.
Figure 5: table of sustainability data provided
| Data | 2017 to 2018 | 2021 to 2022 | 2022 to 2023 |
|---|---|---|---|
| Electricity consumed in office | X | X | X |
| Gas consumed to heat the office space | X | X | X |
| Fugitive emissions from refrigerant use (for air conditioning) | X | ||
| Business travel | X | X | X |
| Waste | X | X | |
| Paper consumption | X | X | X |
| Water | X | X | X |
| Employee commuting (including homeworking) | X | ||
| Purchased goods and services | X | ||
| Capital goods | X | ||
| Energy and fuel related activities | X | X |
The 2021 to 2022 and 2022 to 2023 data provided was then evaluated against criteria outlined in step three of the assessment process outlined above.
The results of this evaluation are outlined below. In summary, our data has moved from partially meeting alignment to the criteria to mostly meeting them over the past two financial years, indicating an improvement in our approach. The drop in consistency and quantification accuracy is due to the inclusion of a greater range of Scope 3 data in 2022 to 2023, which is reliant on both primary data including supplier-provided data such as energy bills and secondary data such as spend data, industry averages and proxy data. As we move towards our 2030 net zero target, we will seek to improve upon the quality of our data, including a greater reliance on primary data.
Figure 6: table of average scores against greenhouse gas accounting principles
| GHG accounting principle | Average score against all data for financial year | |||
|---|---|---|---|---|
| 2021 to 2022 | Score | 2022 to 2023 | Score | |
| Relevance | 1.9 | Partially met | 2.0 | Mostly met |
| Completeness | 2.3 | Partially met | 2.4 | Mostly met |
| Consistency | 1.4 | Limited compliance | 1.1 | Limited compliance |
| Transparency | 1.7 | Partially met | 2.1 | Mostly met |
| Accuracy of data | 1.9 | Partially met | 2.2 | Mostly met |
| Accuracy of emissions quantification | 2.8 | Well met | 2.6 | Well met |
| Average | 1.96 | Partially met | 2.1 | Mostly met |
Our sustainability journey
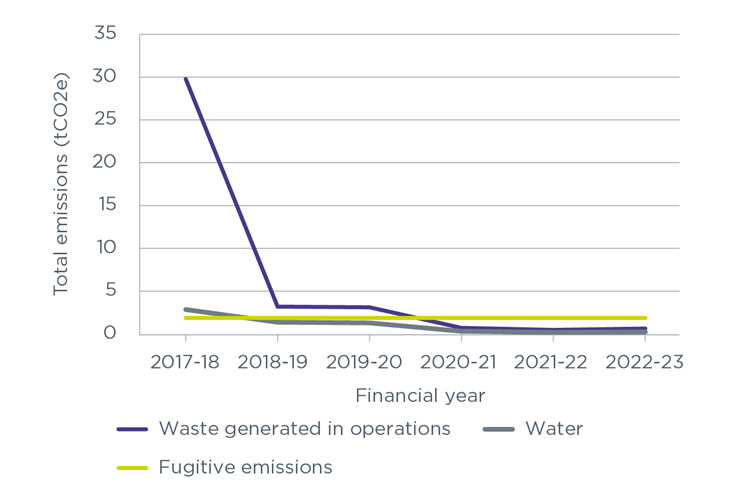
Figures 7 and 8 below outlines the emissions for the areas in scope in relation to our 2030 net zero operational target from our baseline year of 2017 to 2018 to the most recent year of 2022 to 2023.
Figures 7 and 8: Scope 1, 2 and 3 from 2017 to 2018 and 2022 to 2023 (tCO2e)
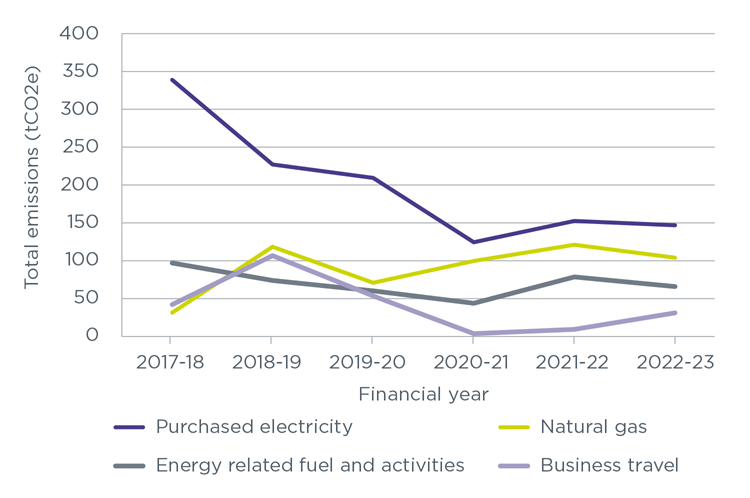
As can be seen in these figures, the general trend for most emissions is down from a 2017 to 2018 baseline. However, there is a rapid decline between 2019 to 2020 and 2020 to 2021, which has since increased slightly.
Perhaps unsurprisingly, much of this can be attributed to the impact of and recovery from COVID-19. Natural gas is the exception as while office attendance was lower, the need to heat the office space remained. However, ventilation was also required to avoid the spread of infection, meaning more windows were open in the colder winter months which led to an increased requirement for heating. The challenge now is to ensure that our interventions are effective in preventing a return to pre-COVID-19 emissions.
It should also be noted that waste data for 2017 to 2018 and fugitive emissions data pre-2022 to 2023 is based on proxy data. The waste data for 2017 to 2018 indicates a high volume of landfill waste, which was reduced to zero in subsequent years.
Full emissions inventory for 2022 to 2023
For the 2022 to 2023 financial year, we were able to build a full profile of our material operational emissions.
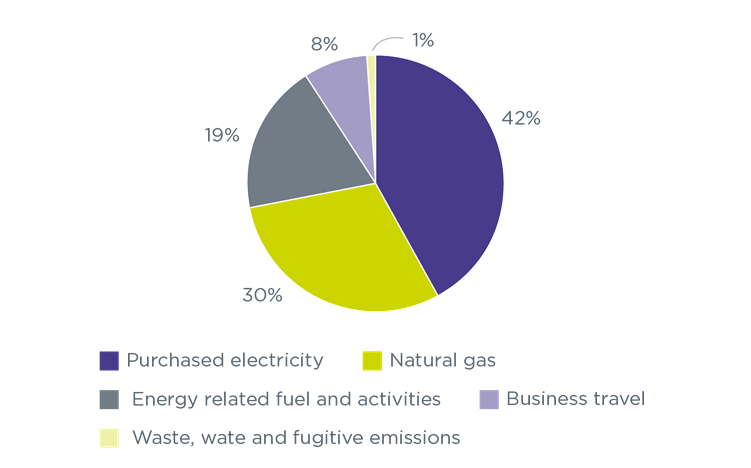
Figure 9 details the percentage split between all Scope 1, 2 and 3 emissions for the 2022 to 2023 financial year, while figure 10 shows the percentage split between only the 2022 to 2023 emissions in scope for our 2030 net zero target. It should be noted that waste, water and fugitive emissions have been combined in this latter figure as they each represent less than 1% of the total.
Figure 9: 2022 to 2023 Emissions split between Scopes 1, 2 and 3
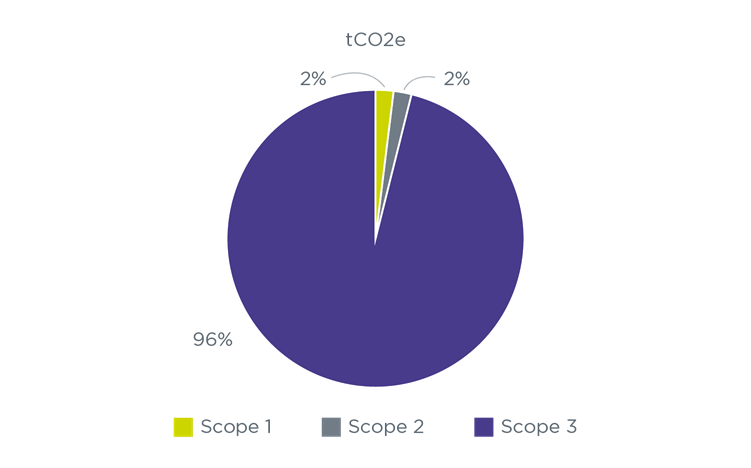
Figure 10: 2022 to 2023 Emissions split between emissions in scope for 2030
The table below outlines the data that we gathered for the 2022 to 2023 financial year, in order of size. Those with an asterisk are in scope for our 2030 net zero target. The remainder will be included in our 2050 net zero target.
Figure 11: table of Scope 1, 2 and 3 data 2022 to 2023
| Category | Emissions scope | tCO2e | % of total emissions |
|---|---|---|---|
| Purchased goods and services | 3 | 5545.02 | 82 |
| Homeworking emissions | 3 | 315.86 | 5 |
| Employee commuting | 3 | 283.66 | 4 |
| Capital goods | 3 | 242.7 | 4 |
| Electricity consumption* | 2 | 144.62 | 2 |
| Gas consumption* | 1 | 101.63 | 1 |
| Energy related fuel and activities* | 3 | 63.47 | 1 |
| Business travel* | 3 | 28.79 | <1 |
| Upstream leased assets | 3 | 11.8 | <1 |
| Fugitive emissions* | 1 | 1.86 | <1 |
| Waste emissions* | 3 | 1.57 | <1 |
| Water consumption* | 3 | 0.23 | <1 |
Figures 9 and 11 highlight that, for us, Scope 3 is by far the largest area of emissions. Within this, our supply chain (procured goods and services, capital goods) makes up the largest component. However, Scope 1 and 2 emissions, while small, are still extremely important as these are in our direct control. We must endeavour to reduce our emissions from gas, fugitive emissions and purchased electricity to align ourselves to the requirements of the GGCs and to set the example as a regulator.
We are fully aware that the biggest impact we can have is to reduce emissions from our supply chain. We have split out and included water consumption from this category in our 2030 target as we have 2017 to 2018 baseline data for it. While this represents a small part of our overall emissions, it is a first step.
Trajectory to net zero
Business as usual scenario
In 2023, we commissioned consultants to undertake a business as usual (BAU) scenario analysis to provide a baseline trajectory from which to compare our net zero ambitions.
The BAU scenario establishes our greenhouse gas emissions trajectory from the 2017 to 2018 financial year out to 2049 to 2050 assuming that we do not take additional steps towards decarbonising our activities beyond what we have already committed to.
In addition, the BAU modelling considers decarbonisation measures happening outside of our control, such as the ongoing decarbonisation of the UK electricity grid.
The purpose of this scenario is to further our understanding of our greenhouse gas emissions profile. This forms the basis from which to derive our decarbonisation roadmap where, through tailored carbon reduction interventions, further reductions in our Scope 1, 2 and 3 emissions can be realised.
Organisational changes
Committed organisational changes have been included as part of the BAU scenario projection.
Office move
In June 2023 we moved from a larger office location in Brighton to a smaller shared office space, resulting in a reduction in floor space from 3,666 metres squared to 2,645 metres squared. Our emissions have changed as a result of this move for a range of reasons (such as having less space to heat and light). To reflect these emission changes, gas, lighting, and refrigerant emissions have been scaled down in the BAU projection.
Hybrid working policy
In October 2023 we announced a new employee working policy aimed at increasing office attendance. This policy was enacted in two phases. Phase 1 was enacted from 1 December 2023 and phase 2 enacted from February 2024. The data modelling shows that throughout phase 1, occupancy levels remain relatively unchanged. Phase 2 is predicted to affect office occupancy more significantly with an expected increase of around 10% from February 2024. This is expected to lead to an increase in emissions from electricity (with the exception of lighting), water, paper, waste and wastewater, employee commuting (although working from home emissions will reduce) and upstream leased assets.
Headcount and organisational expenditure
There are no planned changes to headcount expansion and organisational expenditure so emissions from purchased goods and services, capital goods and business travel are predicted within the BAU scenario to remain fairly constant.
Scope 1 emissions
Scope 1 emissions represent 1.5% of our BAU emissions by the 2029 to 2030 financial year and 2049 to 2050 financial year. It should be noted that, due to the COVID-19 pandemic, there have been large fluctuations in gas use. It is projected that emissions from burning natural gas for heating will fall by 27% between 2022 to 2023 and 2023 to 2024, and that fugitive emissions will fall by 26% between 2022 to 2023 and 2023 to 2024.
Figure 12: BAU Scope 1 Emissions 2017-18 to 2049 to 2050 (tCO2e)
Scope 2 emissions
As seen in figure 13 below, Scope 2 emissions result solely from electricity used within our office and are projected to fall by 90% between 2017 to 2018 and 2029 to 2030, and by a further 9% by 2049 to 2050, owing largely to the decarbonisation of the UK electricity grid. If decarbonisation continues to take place at a slower rate than that predicted by the HM Treasury Greenbook, as is currently the case, the numbers will need to be revised.
In addition, publicly available data states that 35% of total office electricity consumption is attributed to lighting. This has been factored into the BAU model for the reduction of floor space by the office move.
Figure 13: BAU electricity Scope 2 emissions 2017 to 2018 and 2049 to 2050 (tCO2e)
Scope 3 emissions
Eight of the 15 Scope 3 categories are deemed material to our operations. The table below sets out the BAU pathway for these categories, based upon the predicted changes outlined above. Additional points relating to the below table can be found in Appendix A.
Figure 14: table with BAU pathway data for material Scope 3 emissions
| Scope 3 category number | Category description | Emissions 2017 to 2018 (tCO2e) | Emissions 2022 to 2023 (tCO2e) | Emissions 2029 to 2030 (tCO2e) | Emissions 2049 to 2050 (tCO2e) | % of Scope 3 2049 to 2050 |
|---|---|---|---|---|---|---|
| 1 | Purchased goods and services | 5,545 | 5,545 | 5,545 | 5,545 | 86 |
| 7 | Employee commuting (including working from home) | 590 | 590 | 581 | 579 | 9 |
| 2 | Capital goods | 243 | 243 | 243 | 243 | 4 |
| 3 | Fuel and energy related activities | 94 | 63 | 25 | 13 | 0* |
| 5 | Waste generated in operations | 38 | 2 | 2 | 2 | 0* |
| 6 | Business travel | 40 | 29 | 29 | 29 | 0* |
| 8 | Upstream leased assets | 12 | 13 | 13 | 13 | 0* |
| 1 | Water consumption | 3 | <1 | <1 | <1 | 0* |
*Rounded down to zero
2029 to 2030 emissions
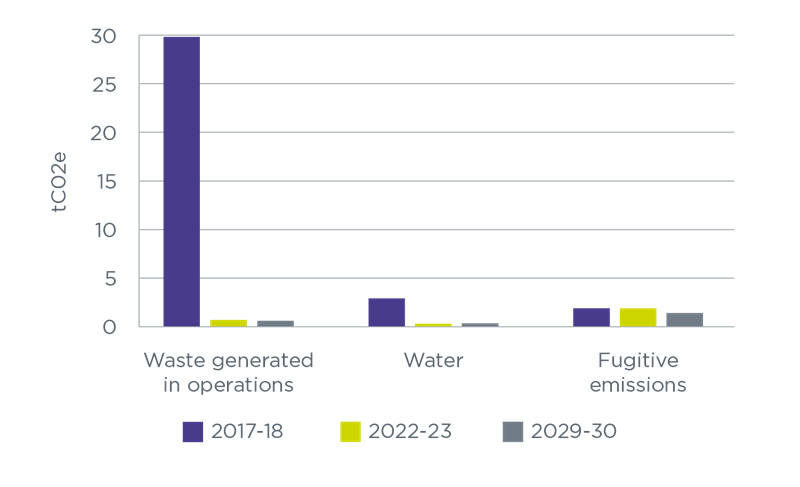
The BAU scenario looks out to 2049 to 2050 in terms of all material emissions for us. However, while our BAU emissions are broadly similar for 2029 to 2030 and 2049 to 2050, our 2030 net zero target considers a narrower scope. Figures 15 and 16 below set out the difference between our 2017 to 2018 and 2022 to 2023 emissions and our 2029 to 2030 BAU projected emissions for just the emissions sources that are in scope for our 2030 net zero target.
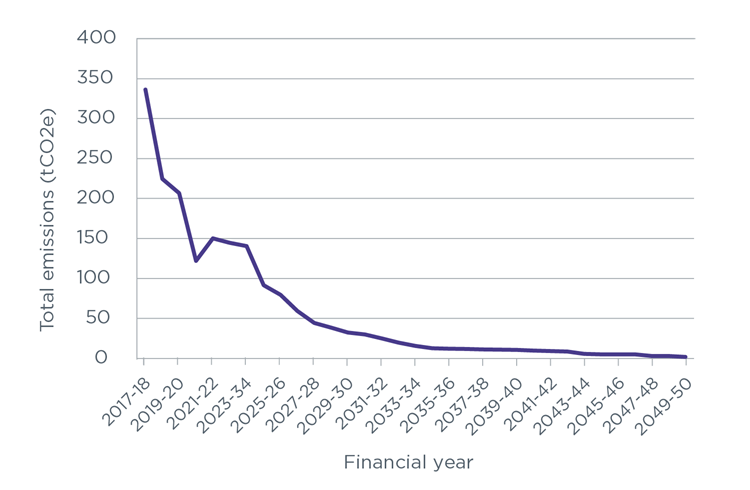
Figure 15: Electricity, gas, energy-related fuel and activities, and business travel 2017 to 2030 (tCO2e)
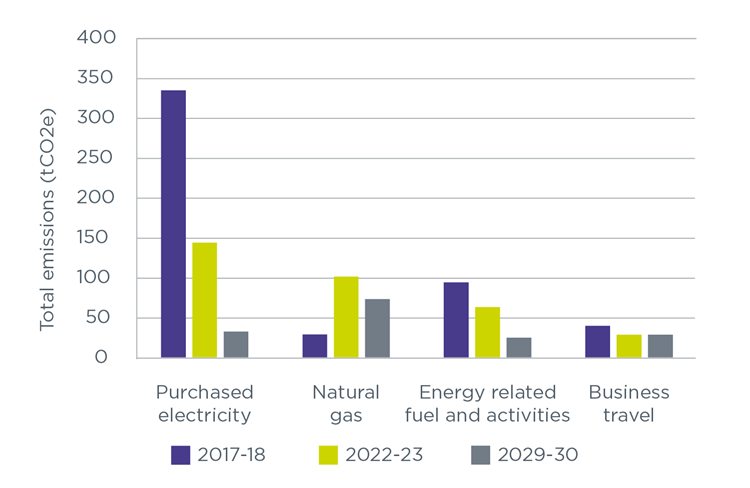
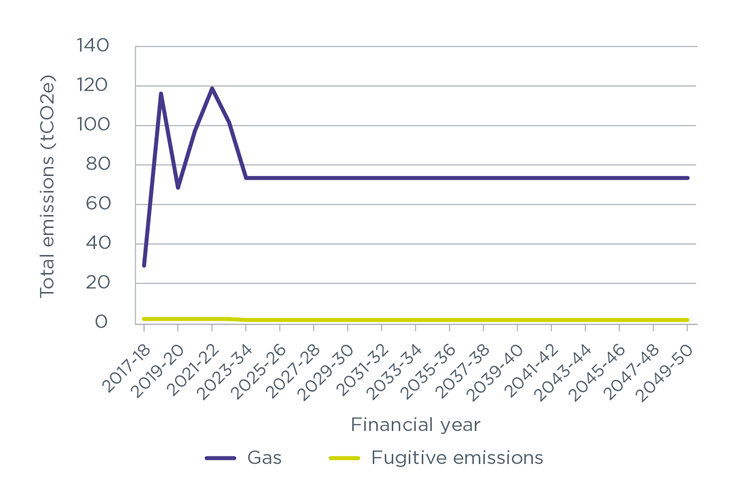
Figure 16: Waste, water and fugitive emissions 2017 to 2030 (tCO2e)
Conclusion of BAU scenario analysis
Results of BAU modelling indicate that Scope 3 emissions will likely represent nearly all of our future emissions by 2029 to 2030 and 2049 to 2050. The majority of emissions result from purchased goods and services, employee commuting (including homeworking) and capital goods.
Scope 1 emissions are expected to remain relatively small compared to Scope 3 emissions at no more than 1.5% of the total across the entire BAU period. Natural gas consumption is fairly low and is assumed to stay constant.
While there is a significant decrease predicted in Scope 2 emissions (largely due decarbonisation of the UK electricity grid), further action is required to reduce Scope 1 and 2 emissions in order to achieve our operational net zero targets. This is especially true of our 2030 net zero target, as gas and electricity consumption make up the largest proportion of emissions sources in scope.
Delivery of net zero: interventions
Identification and modelling of interventions
Working with our consultants, a long list of possible decarbonisation interventions was created. This was achieved through assessing emissions reduction potential and applying knowledge of decarbonisation opportunities across similar organisations. A shortlist was then drawn up by reviewing these interventions against a set of pre-agreed criteria:
- carbon reduction potential
- deliverability
- estimated cost/benefit
- timescale - when the action should be taken
- co-benefits
Timescales were agreed based on typical implementation timelines across the UK, considering time for planning and physical works. Start dates considered our capacity to conduct this work, how best to meet net zero timelines and any pre-requisite measures.
The majority of interventions within this plan are modelled to have achieved their full carbon reduction potential by 2029 to 2030, to align with our operational net zero target of 2030. The decarbonisation of our supply chain does not however reach full reduction potential by this point, as a result of the significant level of engagement and time required for decarbonisation plans to filter across the supply chain.
Interventions for delivering our 2030 net zero target
Our 2030 target covers emissions from Scope 1, Scope 2 and a selection of Scope 3 categories over which we have more influence, using a GGC baseline of 2017 to 2018. Following the decarbonisation programme of interventions below, our emissions are projected to fall 98% by 2029 to 2030 from a 2017 to 2018 baseline. We will therefore need to purchase carbon removals for the 2% of emissions which are projected to remain.
Figure 17 below shows that by 2025 to 2026 a complete reduction in Scope 2 emissions and almost complete reduction in Scope 1 emissions can be achieved, as well as a gradual decline in relevant Scope 3 emissions. It also shows a total reduction of 64% by 2024 to 2025. 'Residual' represents the total of Scope 1, 2 and 3 and 'BAU' is shown for reference.
Figure 17: Emissions from 2017 to 2018 and 2029 to 2030 following interventions modelled
A building audit of our new offices undertaken in 2023 showed that the insulation of the building is already sufficient but that the office building is unsuitable for solar PV. In addition, the nature of our commercial lease and the recent refurbishment works means that no significant building alterations are planned.
The programme of interventions that will deliver the above emissions reductions are listed below in order of the financial years in which implementation will commence. The rollout of these interventions largely reduces the emissions related to natural gas, but subsequently increases Scope 2 and 3 emissions in the short term as a result of increased electricity consumption. However, the procurement of renewable electricity will alleviate these emissions.
2024 onwards
2024 to 2025
- Variable Refrigerant Flow (VRF) air conditioning system used in reverse to heat building (excluding conference room and meeting rooms).
- Installation of additional VRF to include conference room and meeting rooms.
- Reduce operating temperature of office by one degree as a short-term measure before gas displacement.
2024 to 2025 and 2025 to 2026
- Installation of occupancy sensors in rooms with default settings as lights off when unoccupied and to automatically dim in response to natural light levels.
2024 to 2025 and 2026 to 2027
- Desktop energy audit to assess energy demand of IT equipment out of hours and switch to automated shut down across certain times to conserve energy.
- Carbon literacy training for staff and internal campaigns for sustainable behaviours.
2024 to 2025 and 2027 to 2028
- Improve building management system, allowing for effective management of building energy consumption.
2024 to 2025 and 2029 to 2030
- Reduce business travel by phasing out the use of domestic flying for business travel, switching to rail services, alongside an overall 35% reduction in business travel demand through the consideration of increased hybrid attendance at events.
2025 onwards
2025 to 2026
- The full transition of our office electricity (Scope 2) supply to renewable energy, likely through the use of Renewable Energy Certificates from commercial energy suppliers.
- The additional installation of electric water boilers to deliver 100% electric hot water provision.
2025 to 2026 and 2029 to 2030
- Business travel car use to be procured as electric vehicles by default.
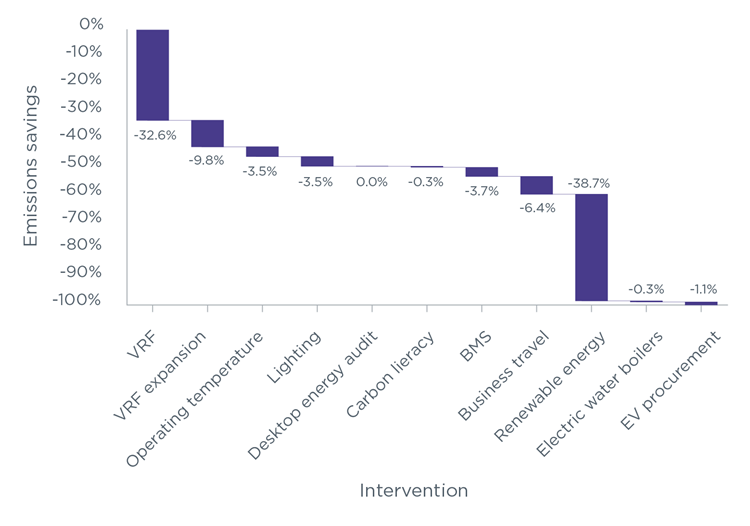
Figure 18 below provides a visual representation of the cumulative impact of each intervention. The procurement of renewable energy has the potential to generate the largest emission reduction at 39%, followed by VRF use in winter at 33%.
Figure 18: Cumulative emissions savings in order of implementation
Interventions for delivering our 2050 net zero target
The 2050 net zero target covers all defined emissions sources across Scope 1, 2 and 3, using a 2022 to 2023 baseline. To progress towards net zero, in addition to the interventions listed above, we will also need to focus on supply chain decarbonisation and the reduction of employee commuting and home-working emissions. The most significant emission reductions will arise from supply chain decarbonisation.
Reducing supply chain emissions will involve engaging with our suppliers across digital and technology, professional services and consultancy, learning and development, and outsourced support services, as these groups currently account for just over 80% of purchased goods and services emissions. We will look to categorise our suppliers based on their progress towards decarbonisation, endeavouring to facilitate progression for the suppliers that are further behind in their journey.
The current supply chain decarbonisation rate is slow. Therefore, to enable scope for greater emissions reductions, we have included supply chain emissions reduction in our 2050 target. As we move forward with this work, we will look to develop interim targets.
Further detail on our progress to both our 2030 and 2050 targets will be provided in our ARA and future sustainability documentation.
Arriving at 2030
Residual emissions
There will be emissions that we cannot feasibly prevent or reduce to zero by 2030. In keeping with best practice, we aim to reduce the emissions in scope for our respective 2030 and 2050 targets by at least 90%. However, in order to effectively deliver net zero we will need to ensure we are dealing with the remaining 'residual' emissions.
Offsets
Common practice is to offset remaining emissions by purchasing carbon credits. This is a way of pricing carbon by providing financial support to projects that avoid or remove greenhouse gas emissions, measured in tonnes of carbon dioxide equivalent (tCO2e).
However, any organisation that seeks to offset a large volume of residual emissions through purchasing cost effective offsets is in danger of being criticised for greenwashing. In fact, in 2023 the European Parliament reached a provisional agreement on banning claims that a product has neutral, reduced or positive impact on the environment based on emissions offsetting schemes. Separately, the FCA is progressing product labelling with the aim of tackling greenwashing across those they regulate, for the benefit of the consumer.
By example, while purchasing carbon credits derived from a solar farm or a hydro-electric dam might avoid the carbon otherwise produced through a coal power plant, there is:
- no guarantee that the greenhouse gas emissions avoided would have been created in the first place
- no actual reduction in existing global greenhouse gas emissions
Therefore, we will ensure that when we arrive at 2030, our emissions will be as low as we can reasonably and feasibly get them. Where offsets are required, we will only purchase carbon credits which are suitable and of reputable quality, and that reflect the removal of greenhouse gas emissions from the atmosphere.
When purchasing these offsets, we will adopt a portfolio diversification approach utilised by the finance sector. The offsets we purchase will provide support to a balanced mix of carbon removal projects, which will help reduce potential risks while distributing important funds across a range of projects.
In summary, we will seek to reduce our in-scope emissions by at least 90%, offsetting the remainder by only purchasing carbon credits that remove greenhouse gases from the atmosphere.
Appendix A: Considerations for Scope 3 BAU Pathway
- The Department for Environment, Food and Rural Affairs' (DEFRA) supply chain tool (Table 13) has been used for emission factors for all purchased goods and service categories (categories 1, 2 and 8). It should be noted that category 4 (upstream transportation and distribution) has been accounted for within purchased goods and services.
- Employee commuting includes the optional Scope 3 boundary of homeworking emissions from IT equipment, heating and lighting based on the EcoAct Methodology.
- Data for BAU emissions from employee commuting has been calculated across various modes of transport and homeworking emissions (IT equipment, lighting and heating); the emissions associated with employee commuting increase, whilst homeworking emissions fall, as a result of the new working policy and associated rise in office occupancy.
- Fuel and energy-related activities comprise of 'Well to Tank' (WTT) emissions associated with gas used and WTT and Transmission and Distribution (T&D) emissions for electricity; tCO2e calculations are based on emissions factors from the Department for Energy Security and Net Zero (DESNZ) and HM Treasury Greenbook.
- There is a significant drop in waste emissions as a result of the phaseout of landfill waste; the remaining waste emissions are associated with energy to waste disposal and recycling-related waste disposal.
- A large fluctuation in business travel emissions resulted from the COVID-19 pandemic due to government-imposed travel restrictions and social distancing; it has been assumed that business travel in the future remains constant at the same rate as in 2022 to 2023.
- While water consumption falls under Purchased Goods and Services and is included in the figures for that category, it has also been split out as it forms part of our 2030 net zero target.