Valuations and recovery plans of UK defined benefit and hybrid pension schemes.
Published: 28 July 2022
You can save the contents of this page as a PDF using your web browser. Open the print options and make sure the destination/printer is set as 'Save as PDF':
Overview
This is the 2022 update to The Pensions Regulator’s (TPR’s) annual funding statistics for UK defined benefit (DB) and hybrid schemes. The underlying data are sourced from valuations and recovery plans submitted to TPR both for schemes with deficit positions, and from annual scheme returns for schemes with surplus positions. The tables in the annex are prepared in accordance with the UK Code of Practice for Official Statistics.
The update is based on tranche 15 schemes with effective valuation dates falling from 22 September 2019 to 21 September 2020 inclusive. These valuations fall within the fifth triennial cycle of scheme funding with due dates for receipt falling within the period December 2020 to December 2021.
This report shows funding trends in the context of market conditions, assumptions and scheme characteristics that impact on valuations. It also describes reported arrangements for recovery plans, employer contributions and contingent security.
The report is comprised of several sections. Specifically, the Tranche 15 summary section summarises the key figures in the current tranche. The Market conditions section discusses market conditions associated with the current tranche. Funding levels are summarised in the Funding levels section and funding strategies are summarised in the Funding strategies section. Valuation assumptions are reported in the Valuation assumptions section. Data summaries (tables) contained in the annex provide more detail on the high-level trends presented in this document. Note that tranche 15 belongs in the cohort with tranches 3/6/9/12, meaning comparisons with other years will generally be limited to these tranches.
Tranche 15 summary
By 21 June 2022, TPR had received over 1,710 valuations (annex Table 1.1) with an effective valuation date covered by tranche 15. Of schemes submitting these valuations, 75.9% had previously submitted valuations in tranches 12, 9, 6 and 3. Over one quarter (27%; annex Table 1.2a) of schemes reported a surplus on the technical provisions (TPs) funding basis.
Assets, liabilities and deficits/surpluses in this report are defined on a TP basis, unless otherwise stated. See the glossary section in the annex for further information. Assets and liabilities grew at approximately equal rates between tranche 12 and 15 for a majority of schemes, resulting in a relatively unchanged average[1] funding ratio on a TPs basis (annex Table 2.1a). Compared to tranche 12, average annual deficit reduction contributions (DRCs) as a proportion of TPs for tranche 15 are lower at the median in nominal terms (annex Table 3.4). The relative increase in average annual DRCs between tranches 12 and 15 is 9% at the median, while the median extension to the recovery plan end date is 1.9 years.
Figure 1, below, illustrates the distribution of changes in deficits measured on a TPs basis for tranche 15 schemes that previously submitted tranche 12 valuations. At the median, scheme assets grew by 7%, whereas TPs grew by 8%. The median relative change in deficits for all schemes is 8%, with around 46% of all schemes experiencing a reduction in deficit over the inter-valuation period.[2]
Figure 1: distribution of the change in deficits from tranche 12 to tranche 15 (all schemes in both tranches)
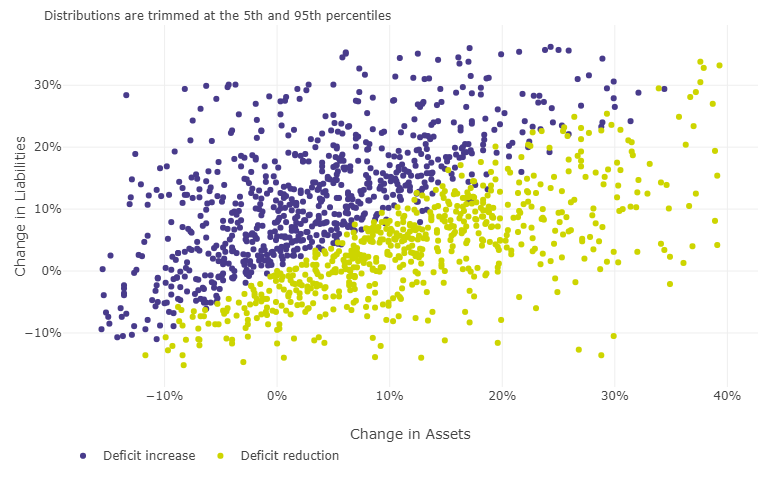
Source(s): TPR
Key figures at a glance
- 27% of schemes in surplus.
- Average ratio of assets to TPs for schemes in deficit and surplus: 88.8% (median: 90.1%).
- Average ratio of assets to TPs for schemes in surplus: 108.4% (median: 104.5%).
- Average ratio of assets to TPs for schemes in deficit: 82% (median: 84.7%).
- Average RP length for schemes in deficit: 5.9 years (median: 5 years).
- Average nominal single effective discount rate (SEDR) for tranche 15 schemes in deficit and surplus: 1.9% (median: 1.82%) with 50% of assumptions falling on or between 1.45% and 2.3%. SEDR is defined in the methodology section of the annex.
- Average real SEDR for schemes in deficit and surplus -1.12% (median: -1.17%); with 50% of assumptions falling on or between -1.5% and -0.75%.
- Median life expectancies (years) of future pensioners currently aged 45 for schemes in deficit and surplus; male: 88.7; female: 91.1.
Market conditions
The equity market fell significantly in March 2020 due to the early COVID-19 pandemic and national lockdowns. Consequently, the FTSE All-Share Total Returns Index for the inter-valuation period between 31 March 2017 and 31 March 2020 (the effective date of many tranche 15 valuations) was -12.2%.[3]
Responding to the initial shock of the pandemic, the Bank of England reduced base rates to 0.1% p.a. and introduced a new round of quantitative easing in March 2020.
Throughout much of the period between March 2017 and March 2020, government gilt yields fluctuated reflecting market volatility and uncertainties, first around the Brexit referendum and later over the period of transition.
The real 20-year spot rate of interest, already in the region of negative yields during the previous valuation period, remained negative (-2.5%) towards the end of the tranche 15 valuation period.
Figure 2, below, shows market expectations for real interest rates as estimated by the Bank of England in the inter-valuation periods.
Forward interest rates at the end of March 2020 potentially indicate market expectations for rising yet negative rates over the time horizon.
Figure 2: UK instantaneous real forward curves
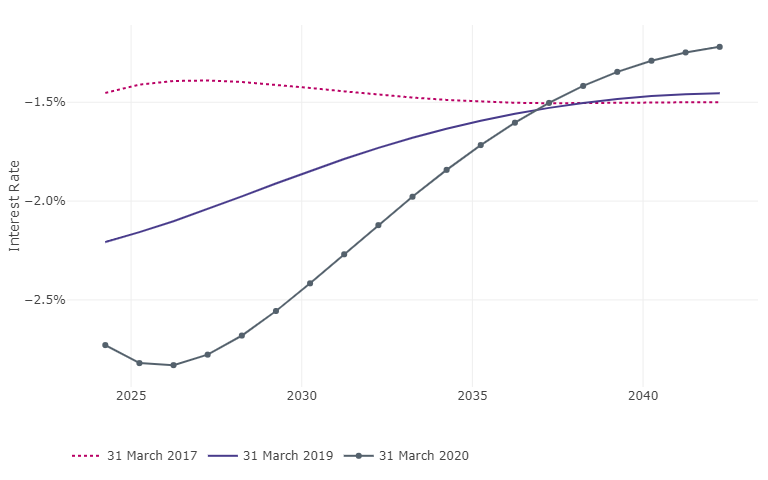
Source(s): Bank of England
Funding levels
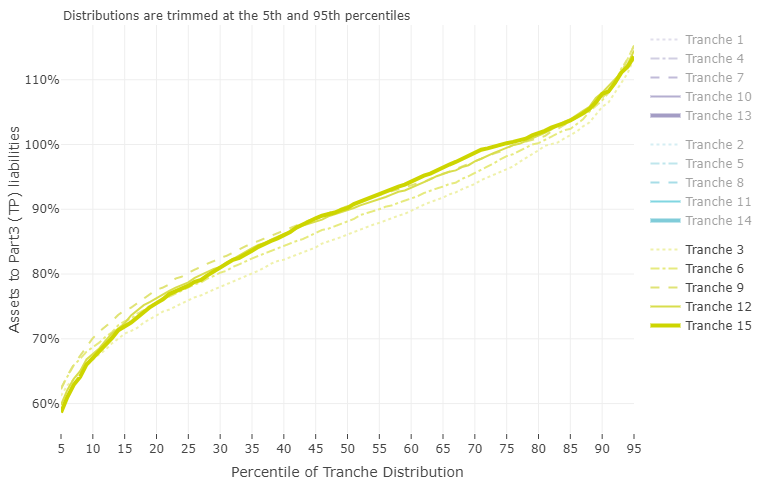
Figure 3, below, shows the distribution of the ratio of assets to TP liabilities for tranche 15 schemes according to scheme maturity group (four categories describing a scheme’s ratio of pensioner TPs to total TPs).
The median level of TP funding ranges from 89% among schemes with maturity levels between 25% and 50% to 98% for schemes with maturity levels of 75% or greater.
Figure 3: assets to part 3 (TP) liabilities (%) by maturity (tranche 15, all schemes)
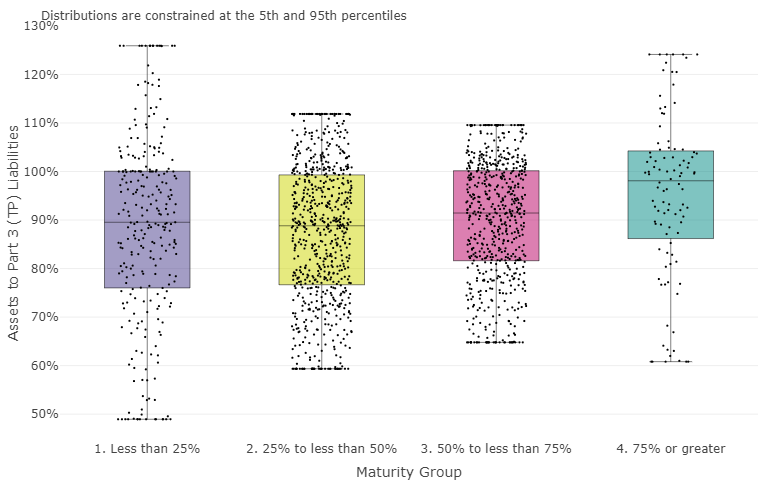
Source(s): TPR
Tranche 15 schemes saw improved asset positions compared to tranche 12 schemes in the previous cycle. This may have been due to the combined impact of:
- sponsor contributions (regular and remedial)
- positive (overall) gains on investments in the three years to valuation
Liabilities have also grown due, in part, to lower investment return assumptions relative to those assumed in the previous valuation — which in turn may have been driven by revised (lower) expectations for long-dated bond yields relative to tranche 12 valuations. In general, schemes with hedged positions in respect of interest rate risk will have fared better overall. Generally speaking, if a scheme had a valuation date of 31 March 2020 (or later) then, all other things being equal, it would have a lower discount rate and a worse TP funding level than if its valuation date was 1 March 2020 or earlier.
- Average ratio of assets to TPs for schemes in deficit and surplus (annex Table 2.1a): 88.8% (median: 90.1%).
- Average ratio of assets to TPs for schemes in surplus: 108.4% (median: 104.5%).
- Average ratio of assets to TPs for schemes in deficit (annex Table 2.3a): 82% (median: 84.7%).
Figure 4, below, illustrates the distribution of the ratio of assets to TPs for tranches 3, 6, 9, 12 and 15 (other tranches are hidden by default). Compared to other tranches in the same cohort, funding levels in tranche 15 are higher from around the 50th percentile of the distribution. At the median, the TP funding ratio for tranche 15 is 90%, compared with 90% among the tranche 12 cohort.[4]
Figure 4: ratio of assets to part 3 (TP) liabilities (%) (all schemes, all tranches)
Source(s): TPR
For schemes submitting valuations in respect of both tranche 12 and tranche 15, the median increase in asset values between valuations is 7%, and the median increase is 8% for TPs. The average ratio of assets to TPs for tranche 15 is 88.8% (93.5% weighted[5]). This represents little to no change on average over tranche 12. The average ratio is generally higher for schemes:
- that report liabilities in respect of active memberships
- with stronger covenants (deficit schemes only)
- without a contingent asset
- with shorter recovery plans
- that are more mature
See Tables 2.1 and 2.3 in the annex for further detail on funding ratios.
For schemes in surplus only, the average ratio of assets to TPs is 108.4% (107.1% weighted).
Funding strategies
Recovery plans
Approximately one in six (16%) of schemes with valuations in both tranche 12 and tranche 15, reported a surplus of assets over liabilities in both tranches. One in ten schemes (10%) moved into a position of surplus, with around one in fourteen (7%) moving into deficit, from a surplus position in tranche 12.
Approximately two-thirds (67%) of schemes with valuations in both tranche 12 and tranche 15 reported a shortfall of assets against liabilities in both tranches. For just over seven out of ten (72%) of these schemes, a reduction in the size of the deficit between tranches (amongst other factors), is associated with a shortened recovery plan period in tranche 15, relative to that agreed under the tranche 12 valuation.
Given the (broadly) three year inter-valuation period itself however, a reduction in recovery plan length of less than three years between tranches still represents an extension to the date at which the scheme is anticipated to be fully funded. Figure 5, below, shows the distribution of changes to recovery plan end dates for tranche 15 schemes that had previously submitted tranche 12 valuations. Just over half of schemes (55%) — including those which remain in surplus — have brought forward their recovery plan end dates or have left them broadly unchanged. Nearly a quarter (24%) of schemes have extended their recovery plan end date by up to three years (representing a recovery plan of a similar length in tranche 15 relative to that agreed in tranche 12), with nearly a quarter (21%) extending their recovery plan end date by more than three years.
Figure 5: distribution of changes to recovery plan end dates, by tranche 12 and tranche 15 recovery plan length groups (schemes in both tranches 12 and 15)
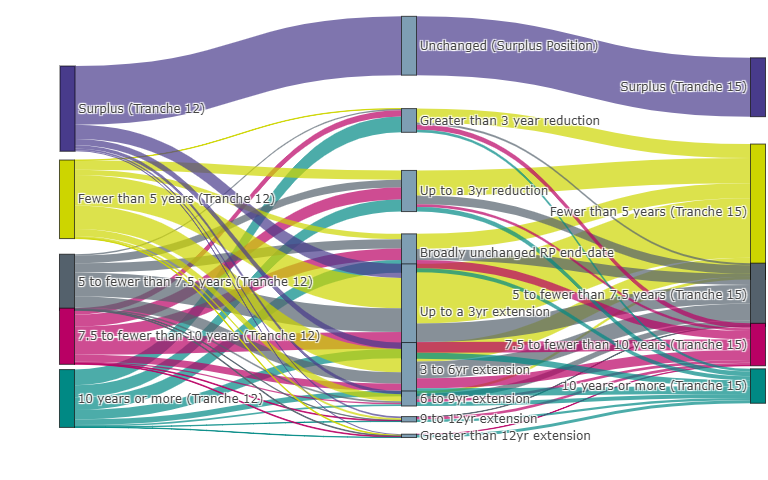
Source(s): TPR
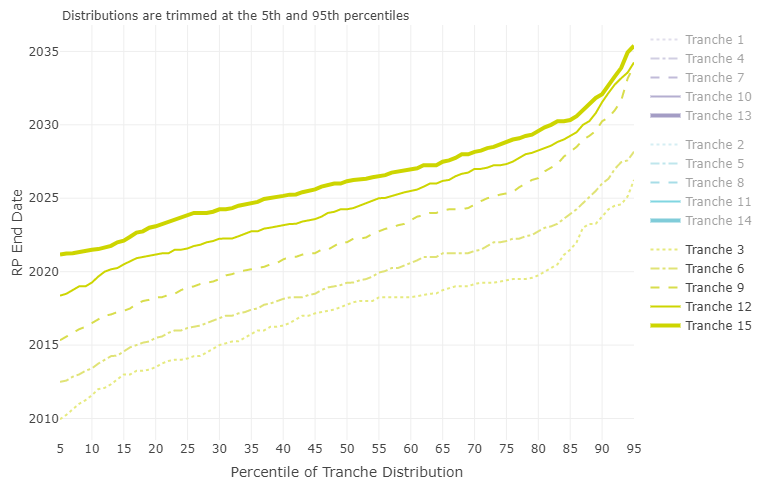
Figure 6, below, highlights the distribution of recovery plan end dates by tranche (tranches other than the 3/6/9/12/15 cohort are hidden by default).
Although the end dates for recovery plans have increased in tranche 15 across the distribution, there has been a narrowing in the upper half of the distribution, ie 55th percentile and above.
Compared with tranche 12, tranche 15 end dates have increased by 1.9 year at the median, 1.5 years at the 75th percentile and 1.1 year at the 95th percentile.
Figure 6: distribution of recovery plan end dates (schemes in deficit, all tranches)
Source(s): TPR
In respect of their first valuations under scheme-specific funding, schemes in tranche 3 had a median recovery plan end date falling in 2017. Under the fifth cycle of funding, broadly the same set of schemes have a median recovery plan end date falling in 2026 (see: tabular output for Figure 6).
The mean and median recovery plan lengths for tranche 15 schemes in deficit are 5.9 and 5 years respectively. For tranche 12 these figures were 7.1 and 6.3 years respectively (annex Tables 3.3 and 3.1).
Longer recovery plans tend to be associated with schemes:
- with weaker covenant support[6]
- with lower levels of funding on a TP basis
- with at least one contingent asset (annex Table 3.3)
- with holding higher proportions of return seeking assets
See Tables 3.1, 3.2 and 3.3 in the annex for more detail on recovery plan length.
Figure 7, below, shows the distribution of recovery plan lengths for tranche 15 schemes by covenant group[7]. Three quarters of schemes in covenant group 1 (strong) have recovery plans of up to 6.2 years, while the same proportion of schemes in covenant group 4 (weak) have recovery plans of up to 11.5 years.
Figure 7: distribution of recovery plan length by covenant group (tranche 15 schemes in deficit)
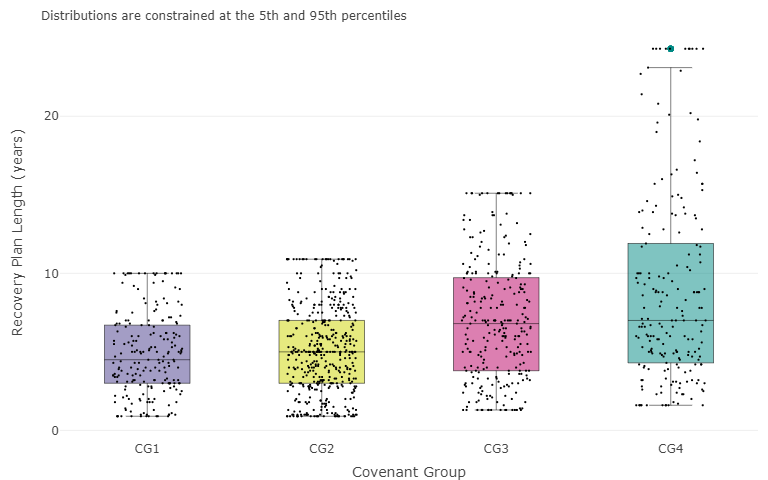
Source(s): TPR
The table, below, shows the median extension to recovery plan end date according to covenant group migration. The largest increase is 2.5 years for schemes migrating from covenant group 2 to covenant group 3 over the inter-valuation period. Generally, the smallest transitions are associated with schemes which stayed within the same covenant group.
Table: median recovery plan end date extension by covenant group migration (tranche 15 schemes in deficit only)
| Covenant group (tranche 15) | ||||
|---|---|---|---|---|
| Covenant group (tranche 12) | 1 | 2 | 3 | 4 |
| 1 | 1.5 | 2 | ||
| 2 | 0.9 | 0.9 | 2.5 | -0.1 |
| 3 | -0.1 | 0.1 | 0.5 | 1.4 |
| 4 | -0.1 | 2 | 0.1 | |
Source(s): TPR
Contributions
As a proportion of liabilities calculated on a TPs basis, the average annual DRCs for tranche 15 schemes is 1.9%.
This is influenced by increases in liabilities calculated on a TPs basis, as well as changes in nominal DRCs. The median increase in TPs is 8% and the corresponding relative increase in average annual DRCs is 9%. A higher level of DRCs as a percentage of liabilities on a TPs basis is associated with:
- shorter recovery plans
- smaller schemes (by both TPs and members)
- lower maturity
- schemes with a lower ratio of assets to TPs
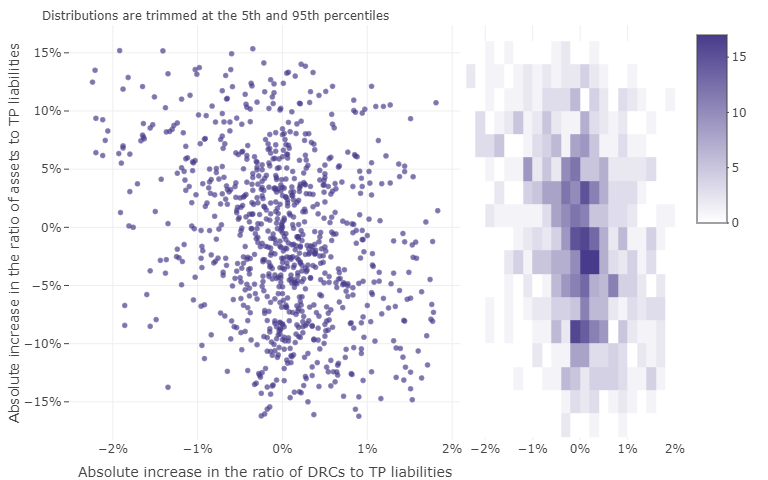
Figure 8, below, shows the extent to which the percentage point increase in average annual DRCs as a proportion of TPs varies by the percentage point increase in TPs funding between tranche 12 and tranche 15 (schemes in deficit).
Figure 8: absolute percentage increase in DRCs as a proportion of TP liabilities vs. absolute percentage increase in the ratio of assets to TPs (schemes in deficit only; tranche 12 to 15)
Source(s): TPR
Asset allocation
The majority of tranche 15 schemes have less than 40% of assets invested in return-seeking[8] asset classes, while around a sixth of schemes have more than 60% allocated to return-seeking asset classes. (annex Table 1.2a)
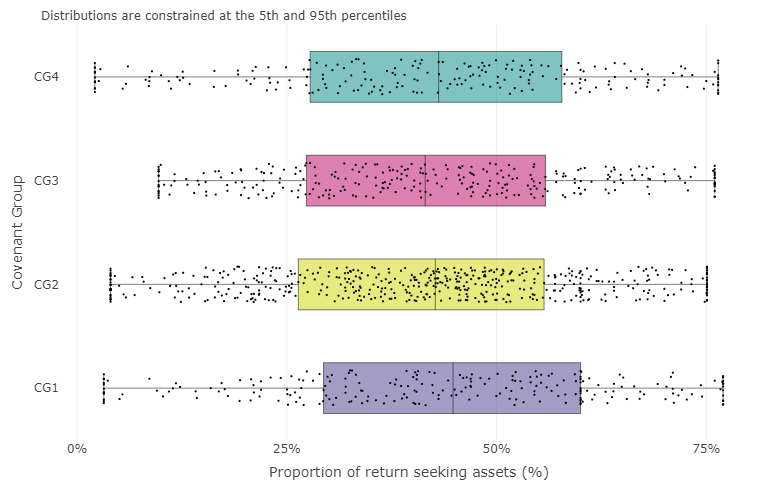
Figure 9a, below, shows the distribution of return-seeking assets by covenant group. The median allocation to return-seeking assets is 45% for covenant group 1 schemes. For covenant group 4 schemes, this value was also 43%. The allocation to return-seeking assets are fairly similarly distributed across covenant groups.
Figure 9a: distribution of return-seeking assets by covenant group (tranche 15 schemes in deficit)
Source(s): TPR
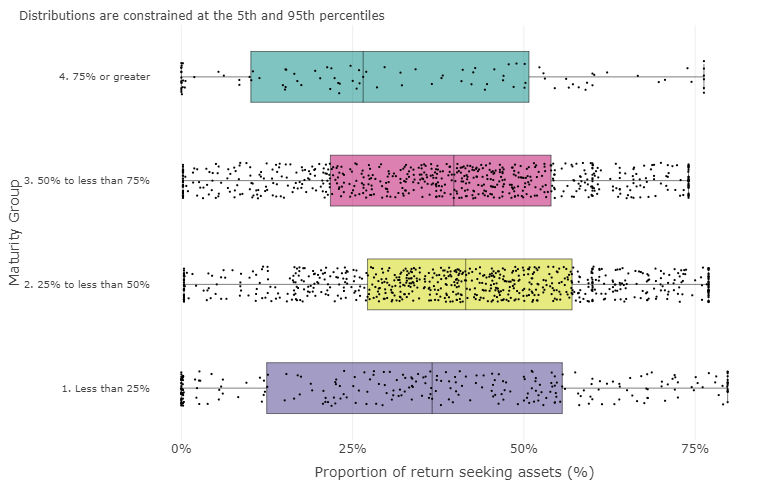
Figure 9b, below, shows the distribution of return-seeking assets by maturity group (as measured by the ratio of pensioner liabilities to total liabilities). The median allocation to return-seeking assets is 42% for schemes with 25% to less than 50% maturity, compared to 27% for schemes with greater than 75% maturity. Generally, we observe a decreased allocation to return-seeking in the most mature group, compared to the others.
Figure 9b: distribution of return-seeking assets by scheme maturity group (tranche 15 schemes in deficit)
Source(s): TPR
Contingent security
Fewer than a fifth (18.7%) of tranche 15 schemes have additional security in the form of one or more contingent assets, which typically, but not always, take the form of guarantees from a sponsor’s parent or associated group entity.
Around one in twenty (5.8%) schemes have contingent assets that are formally recognised by the PPF in the calculation of the PPF risk-based levy. Just over one in ten schemes (13.3%) have contingent assets that are not recognised by the PPF but are reported as additional security in support of funding.
The presence of contingent assets is associated with larger schemes, by both members and liabilities.
See Tables 2.6 and 2.7 in the annex for more information on contingent security
Valuation assumptions
Discount rates
Market experience and changing expectations over the inter-valuation period may be reflected in discount rates to varying degrees — depending on investment strategy and/or valuation approach. The statistics show an association between the TPs discount rate and a scheme’s investment strategy. The investment strategy of a scheme is approximated here by the scheme’s allocation to return-seeking assets. It may also consider the ability of the employer to underwrite downside risk.
The 20-year nominal spot rate on gilts declined to 0.76% at the end of the tranche 15 valuation period. The gap between implied inflation and the nominal gilt yield, which had widened during the tranche 12 to tranche 15 inter-valuation period, kept real yields negative over the three-year period between most valuations.
For 31 December 2019 and 31 March 2020 (the two most common tranche 15 valuation dates), the 20-year spot rates on gilts were 1.35% and 0.8% respectively, while the corresponding median single effective discount rates (SEDR) for valuations were 2.18% and 1.66% respectively. The median SEDR fell further below the rate of 20-year market implied inflation, relative to the position a year earlier.
Figure 10, below, shows the median SEDR relative to 20-year UK gilts, 20-year spot inflation, and greater than 15-year AA-rated corporate bonds (for schemes in deficit in tranches 1 to 7 and for all schemes in tranches 8 to 15).
Figure 10: median (nominal) SEDR, Bank of England nominal gilts 20-year spot rate, greater than 15-year AA corporate bonds, and BOE 20-year inflation
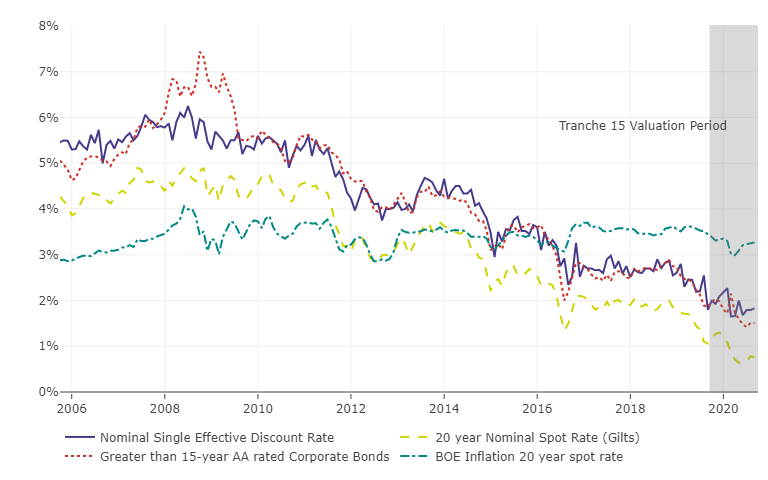
Source(s): TPR, Thomson Reuters, Bank of England, Markit iBoxx
The average real SEDR is -1.12% for tranche 15, compared to -0.68% for tranche 12.
Schemes with a higher proportion of return-seeking assets tend, on average, to assume a higher discount rate. The implied level of outperformance over gilts in the discount rate appears to have an even stronger relationship to the proportion of return-seeking assets held by schemes - although there is a wide range of assumptions in discount rate outperformance among schemes with a similar allocation to return-seeking assets.
The average assumed return over nominal gilts is marginally lower for tranche 15, compared to tranche 12. However, the average assumed real return over nominal gilts is marginally higher for tranche 15 than tranche 12. The average outperformance of the real SEDR over the 20-year real government spot rate is 1.11% for tranche 15, compared to 1.06% for tranche 12.
See Table 4.2 in the annex for more information on discount rates
Life expectancies
While there were notable increases in average assumed life expectancies over the first three funding cycles, reflecting stronger mortality assumptions over that period, assumptions regarding average life expectancy are generally lower for tranche 15 schemes relative to tranches 12 and 9, for both future and current pensioners.
See Tables 6.1 to 6.2 in the annex for more information on life expectancies
This reflects the general trend observed in the wider population over the last few years and that almost all schemes use the CMI mortality projection model when allowing for future improvements (see Tables 5.1 to 5.4 in the annex).
In respect of the underlying mortality assumptions:
- 88% of tranche 15 schemes use the Self-Administered Pension Scheme (SAPS) tables
- 54% apply a scaling factor or rating to base tables to adjust for scheme experience
- 95% use the continuous mortality investigation (CMI) projection model (first published in 2009) to allow for future improvements
- while 80% of schemes assume a long-term rate of improvement/underpin of 1.5% or higher with 5% assuming a rate of 2% or higher
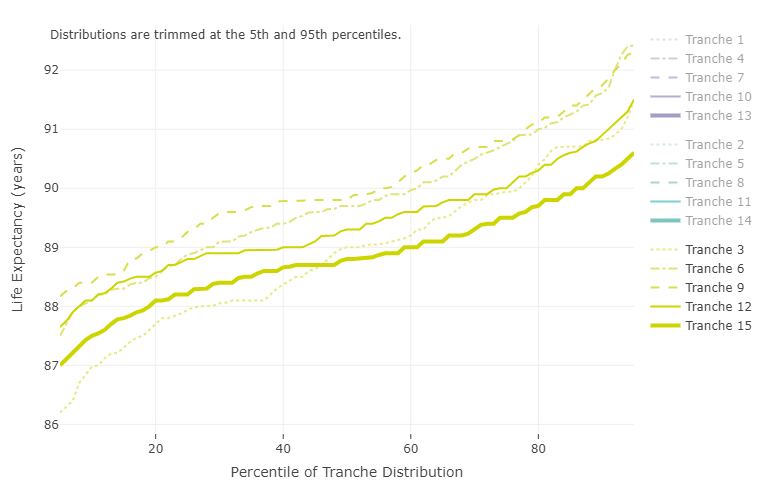
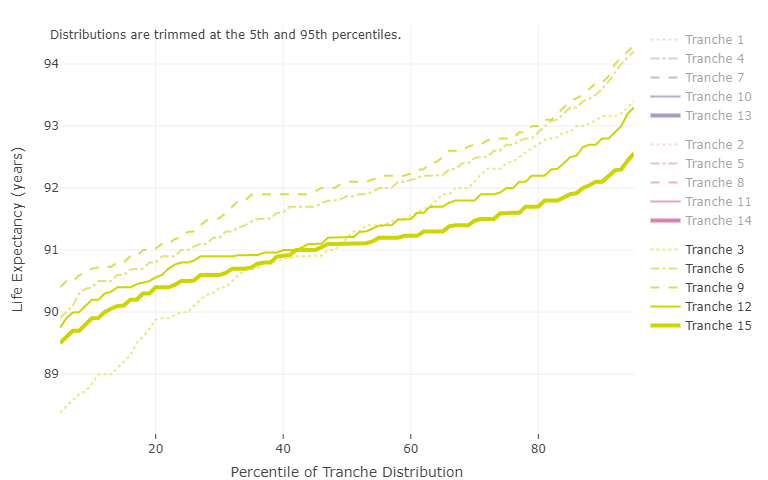
Figures 11a and 11b, below, show the distribution of assumed life expectancies for future male and female pensioners currently aged 45 respectively, for tranches 3, 6, 9, 12 and 15. Generally, tranche 15 life expectancy is at its lowest for both males and females since tranche 3.
Figure 11a: distribution of life expectancy assumptions for future male pensioners currently aged 45 (all tranches)
Source(s): TPR
Figure 11b: distribution of life expectancy assumptions for future female pensioners currently aged 45 (all tranches)
Source(s): TPR
Footnotes
- [1] Where ‘average’ is used in the report, it refers to the mean.
- [2] Summary statistics in the body of the text may not match exactly those presented in the figures as the figures use trimmed distributions to mask outliers.
- [3] FTSE Russell Factsheet March 2020.
- [4] Summary statistics in the body of the text may not match exactly those presented in the figures as the figures use trimmed distributions to mask outliers.
- [5] Weighted by TPs.
- [6] Covenant groups (1 to 4) are assigned at the point of initial RP reviews to facilitate prioritisation. These grades may vary to the view taken during case-level intervention, where a wider range of information is taken into account. They are defined as: covenant group 1 - strong; covenant group 2 - tending to strong; covenant group 3 - tending to weak; and, covenant group 4 - weak. Covenant assessments are not usually undertaken for schemes in surplus.
- [7] See previous footnote.
- [8] ‘Return-seeking assets’ in this report include equities, commodities, 60% of insurance policies, 75% of property, 80% of hedge funds, 25% of corporate bonds and assets held in the ‘other’ category.