Annual report on defined benefit (DB) occupational pension schemes, including those also providing defined contribution (DC) benefits.
Published: 8 December 2022
Updated: 31 August 2023
This report has been republished to account for data corrections following investigations into our underlying data. The data affected is primarily deferred memberships of public sector schemes, although there is a small change to active memberships of public sector schemes. The incorrect data was caused by a scheme submitting incorrect values in their scheme return and they have since updated their data.
You can save the contents of this page as a PDF using your web browser. Open the print options and make sure the destination/printer is set as 'Save as PDF':
Introduction
The data
The data contained in this statistical release was submitted by occupational defined benefit (DB) pension schemes registered with The Pensions Regulator (TPR) in annual scheme returns.
The data set builds on previous releases, focusing specifically on the population of UK DB pension schemes, effective as of 31 March 2022. Data presented for prior periods may differ to that presented in previous releases for a number of reasons including:
- late / subsequent submission of data from schemes affecting their position in prior periods
- changes to the identification and treatment of DB relevant small schemes (formerly known as DB small self-administered schemes)
- changes to the identification and treatment of schemes eligible for the Pensions Act 2004 Part 3 funding regime
- changes to data coverage resulting from enhanced data validation and cleaning
As some individuals may have a number of pension entitlements spread over a number of schemes, they may be included more than once in the total memberships under consideration.
Figure totals may reflect rounding, and the sum of proportions or percentage figures may not equate to exactly 100% in all instances for this reason.
Private sector occupational DB schemes
The data set used in this publication is primarily based on an extract from the pension schemes register as of 31 March 2022. This aims to include registrable DB and hybrid occupational schemes with more than one member that are eligible for the Pension Protection Fund (PPF) and / or are subject to the Pensions Act 2004 Part 3 funding regime as of 31 March 2022, with the addition of those schemes in the process of winding up.
This year, the main DB landscape data set covers 5,378 schemes[1]. The declining universe – in terms of the year-on-year population presented here – reflects schemes completing the process of winding up, scheme mergers and schemes entering the PPF.
The data set underpinning the Part 3 technical provisions (TPs) funding figures covers a lesser 5,123 schemes, as we are not able to calculate funding figures for all schemes in the parent population of 5,378 at the calculation effective date. Schemes in the process of winding up are not processed in this way, for example, and there are instances where a scheme is not yet liable to submit a Part 3 valuation, or where certain items of data used in the calculation were not available. The data set used for funding covers 97% of the memberships found in the parent population of 5,378 schemes.
This data differs from the PPF’s Purple Book data set in that the latter includes only those schemes eligible for the PPF. Read more about PPF eligibility on the PPF website. The schemes in this data set that do not appear in the Purple Book will include schemes with a Crown guarantee and others with features prohibiting PPF eligibility. The additional schemes make up a relatively small proportion of the population by membership and assets – more details can be found in the appendix.
Schemes with more than 5,000 members account for around 75% of each of the population’s total assets, liabilities and members, while only forming around 7% of the total number of schemes in the main data set. Conversely, schemes with fewer than 1,000 members make up around 80% of the total number of schemes but only around 10% of total assets, liabilities and members.
Public service occupational DB schemes
The data covering public service occupational DB pension schemes is presented separately to that covering private sector occupational DB pension schemes.
Public service pension schemes provide pensions for civil servants, the judiciary, local government, teachers, health service workers, members of fire and rescue services, members of police forces and members of the armed forces. These schemes cover over 17.2 million memberships, and around 25,000 individual employers.
Until 2015, pension provision in the public sector was provided on a final salary basis. Since then, however, workers in all open public service schemes have accrued benefits on a Career Average (CARE) basis.
There are 21 public service pension schemes. Of these, the Local Government Pension Scheme, Fire and Rescue Service Pension Scheme and Police Pension Scheme are locally administered. We treat each of the locally administered sections as a separate scheme and therefore regard the public service landscape as having 204 schemes.
Public service pension schemes are governed differently from other occupational pension schemes. They do not have trustees – instead the overall management and / or administrative responsibility for the schemes sits with scheme managers. Scheme managers are supported by pension boards, which assist them in complying with their legal duties. The local government pension schemes and some existing public body schemes are funded, but the others all operate on a ‘pay as you go’ basis.
Part 3 funding figures
The funding figures presented in this release represent estimated assets and TPs liabilities of private sector occupational DB schemes, rolled forward from their most recent Pensions Act 2004 Part 3 actuarial valuation to a common date of 31 March 2022.
An actuarial or funding valuation is a calculation made by an actuary of the assets needed for the scheme to meet its statutory funding objective. These include pensions in payment (including those payable to survivors of former members) and benefits accrued by other members and beneficiaries, which will become payable in the future.
We have processed the figures so they are all estimated at a common date of 31 March 2022. The model is designed to estimate individual scheme specific data from different dates (for example, scheme specific date of actuarial valuations) to a single date for all schemes.
The model estimates changes in the amount of liabilities for individual schemes between their latest valuation date (as reported by the trustees in their scheme return or recovery plan submission) and a common date by tracking changes in fixed interest and index-linked gilt yields and prior to the COVID-19 pandemic by tracking the results from the annual CMI mortality projections analysis. Due to the uncertain impact of COVID-19, we have not made any further adjustments on how this might impact the trustees’ mortality assumption. It measures the corresponding changes in asset positions by tracking the performance of the relevant indices (based on the asset allocations as reported by the trustees in their scheme return).
The model tracks the effect of changed market conditions between these two dates on a consistent basis for all schemes. This basis is reviewed regularly. It does not consider any other changes to a scheme’s asset and liability profile due to scheme experience, benefit changes, post valuation benefit accrual, demographic changes, curtailments, settlements, changes in asset strategy, scheme specific investment performance, contingent assets, or covenant support.
Footnotes for this section
- [1] The number of schemes in this estimate as of 31 March 2022 could be different from 5,378 if any of these schemes are discovered to be ineligible for PPF protection / the Part 3 regime, or if any additional schemes are discovered to be eligible for PPF protection / the Part 3 regime, as of 31 March 2022.
Scheme status and memberships
Scheme status in this release is split between:
- open schemes, where new members can join the DB section of the scheme and accrue benefits
- schemes closed to new members (CTNM), in which existing members continue to accrue benefits
- schemes closed to future accruals (CTFA), where existing members can no longer accrue new years of service and no new members can join
- schemes that are in the process of winding up
Where schemes provide both DB and DC benefits, it is often the case that it is no longer possible to join as a member accruing defined benefits. In these cases, we have adjusted the status to CTNM. 62 schemes had their status changed in this way, encompassing around 494,000 memberships.
Where schemes have no active DB accruing memberships, the status is adjusted to CTFA. 140 schemes had their status adjusted in this way, which in total comprised around 935,000 memberships.
In all other cases, statuses are taken to be as submitted by the scheme.
Schemes by status
Figure 1: Distribution of schemes by status
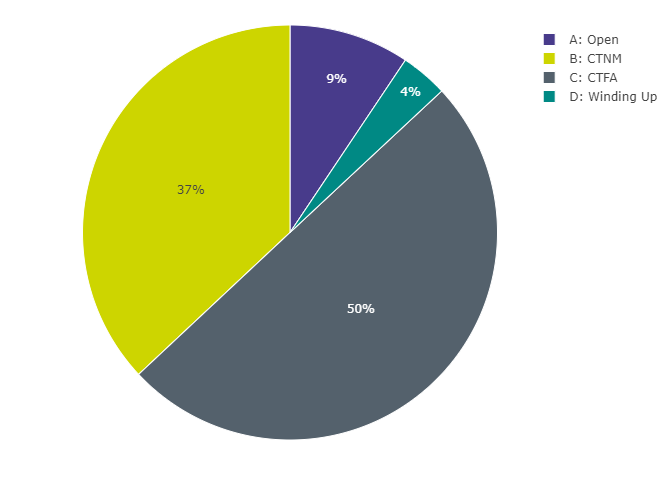
Figure 1 data: Data underlying Figure 1, pertaining to the distribution of schemes by status
| Status | Number of Schemes |
|---|---|
| A: Open | 505 |
| B: CTNM | 1,989 |
| C: CTFA | 2,687 |
| D: Winding Up | 197 |
Table 1: Scheme status by year
| 2012 | 2013 | 2014 | 2015 | 2016 | 2017 | 2018 | 2019 | 2020 | 2021 | 2022 | |
|---|---|---|---|---|---|---|---|---|---|---|---|
| A: Open | 13% | 13% | 13% | 13% | 13% | 13% | 12% | 11% | 10% | 10% | 9% |
| B: CTNM | 48% | 47% | 48% | 47% | 46% | 45% | 44% | 41% | 40% | 38% | 37% |
| C: CTFA | 28% | 31% | 33% | 34% | 36% | 39% | 41% | 44% | 47% | 48% | 50% |
| D: Winding Up | 11% | 9% | 7% | 6% | 5% | 4% | 4% | 3% | 3% | 4% | 4% |
| Total | 100% | 100% | 100% | 100% | 100% | 100% | 100% | 100% | 100% | 100% | 100% |
| Number of schemes | 7,297 | 6,974 | 6,657 | 6,396 | 6,206 | 5,973 | 5,805 | 5,701 | 5,604 | 5,522 | 5,378 |
Table 2: Scheme status by year excluding schemes offering both DB and DC benefits
| Status | 2012 | 2013 | 2014 | 2015 | 2016 | 2017 | 2018 | 2019 | 2020 | 2021 | 2022 |
|---|---|---|---|---|---|---|---|---|---|---|---|
| A: Open | 15% | 15% | 15% | 14% | 14% | 13% | 12% | 11% | 10% | 10% | 10% |
| B: CTNM | 46% | 46% | 46% | 46% | 45% | 43% | 42% | 40% | 39% | 37% | 36% |
| C: CTFA | 27% | 30% | 32% | 34% | 36% | 39% | 41% | 45% | 47% | 49% | 50% |
| D: Winding Up | 12% | 9% | 7% | 6% | 5% | 5% | 4% | 4% | 4% | 4% | 4% |
| Total | 100% | 100% | 100% | 100% | 100% | 100% | 100% | 100% | 100% | 100% | 100% |
Figure 2: Distribution of schemes by status and year
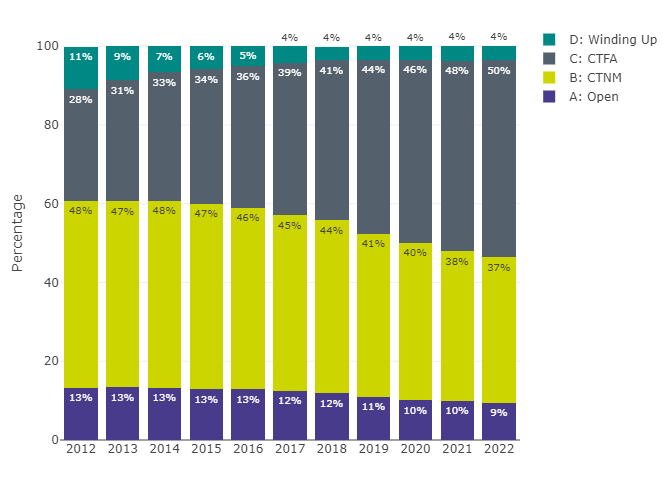
Figure 2 data: Data underlying Figure 2, pertaining to the distribution of schemes by status and year
| Status | Year | Percentage |
|---|---|---|
| A: Open | 2012 | 13% |
| A: Open | 2013 | 13% |
| A: Open | 2014 | 13% |
| A: Open | 2015 | 13% |
| A: Open | 2016 | 13% |
| A: Open | 2017 | 12% |
| A: Open | 2018 | 12% |
| A: Open | 2019 | 11% |
| A: Open | 2020 | 10% |
| A: Open | 2021 | 10% |
| A: Open | 2022 | 9% |
| B: CTNM | 2012 | 48% |
| B: CTNM | 2013 | 47% |
| B: CTNM | 2014 | 48% |
| B: CTNM | 2015 | 47% |
| B: CTNM | 2016 | 46% |
| B: CTNM | 2017 | 45% |
| B: CTNM | 2018 | 44% |
| B: CTNM | 2019 | 41% |
| B: CTNM | 2020 | 40% |
| B: CTNM | 2021 | 38% |
| B: CTNM | 2022 | 37% |
| C: CTFA | 2012 | 28% |
| C: CTFA | 2013 | 31% |
| C: CTFA | 2014 | 33% |
| C: CTFA | 2015 | 34% |
| C: CTFA | 2016 | 36% |
| C: CTFA | 2017 | 39% |
| C: CTFA | 2018 | 41% |
| C: CTFA | 2019 | 44% |
| C: CTFA | 2020 | 47% |
| C: CTFA | 2021 | 48% |
| C: CTFA | 2022 | 50% |
| D: Winding Up | 2012 | 11% |
| D: Winding Up | 2013 | 9% |
| D: Winding Up | 2014 | 7% |
| D: Winding Up | 2015 | 6% |
| D: Winding Up | 2016 | 5% |
| D: Winding Up | 2017 | 4% |
| D: Winding Up | 2018 | 4% |
| D: Winding Up | 2019 | 4% |
| D: Winding Up | 2020 | 4% |
| D: Winding Up | 2021 | 4% |
| D: Winding Up | 2022 | 4% |
Figure 3: Distribution of schemes by status and member group
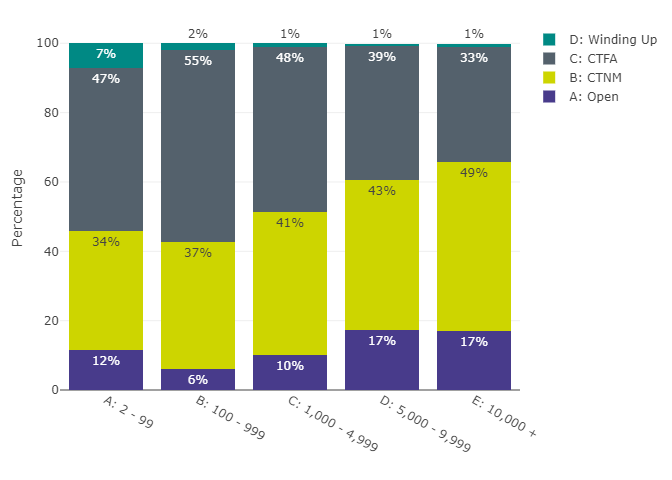
Figure 3 data: Data underlying Figure 3, pertaining to the distribution of schemes by status and member group
| Status | Member Group | Percentage |
|---|---|---|
| A: Open | A: 2 - 99 | 12% |
| A: Open | B: 100 - 999 | 6% |
| A: Open | C: 1,000 - 4,999 | 10% |
| A: Open | D: 5,000 - 9,999 | 17% |
| A: Open | E: 10,000 + | 17% |
| B: CTNM | A: 2 - 99 | 34% |
| B: CTNM | B: 100 - 999 | 37% |
| B: CTNM | C: 1,000 - 4,999 | 41% |
| B: CTNM | D: 5,000 - 9,999 | 43% |
| B: CTNM | E: 10,000 + | 49% |
| C: CTFA | A: 2 - 99 | 47% |
| C: CTFA | B: 100 - 999 | 55% |
| C: CTFA | C: 1,000 - 4,999 | 48% |
| C: CTFA | D: 5,000 - 9,999 | 39% |
| C: CTFA | E: 10,000 + | 33% |
| D: Winding Up | A: 2 - 99 | 7% |
| D: Winding Up | B: 100 - 999 | 2% |
| D: Winding Up | C: 1,000 - 4,999 | 1% |
| D: Winding Up | D: 5,000 - 9,999 | 1% |
| D: Winding Up | E: 10,000 + | 1% |
Membership by status
Figure 4: Distribution of memberships by status
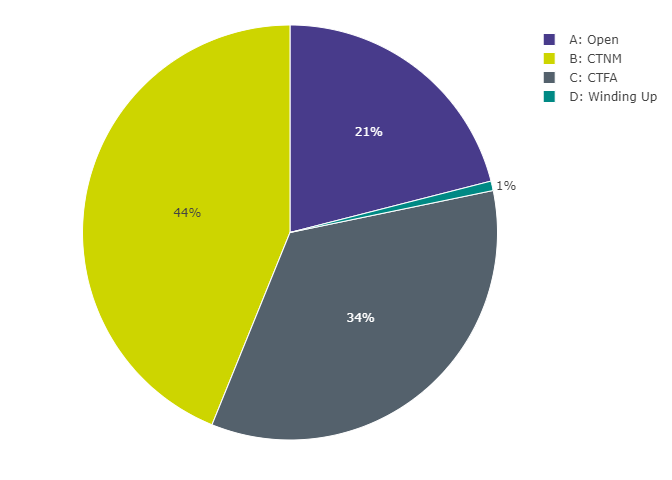
Figure 4 data: Data underlying Figure 4, pertaining to the distribution of memberships by status
| Status | Number of memberships | Percentage of memberships |
|---|---|---|
| A: Open | 2,058,777 | 21% |
| B: CTNM | 4,297,402 | 44% |
| C: CTFA | 3,368,114 | 34% |
| D: Winding Up | 72,357 | 1% |
Table 3: Distribution of memberships by status and year
| Status | 2012 | 2013 | 2014 | 2015 | 2016 | 2017 | 2018 | 2019 | 2020 | 2021 | 2022 |
|---|---|---|---|---|---|---|---|---|---|---|---|
| A: Open | 25% | 21% | 21% | 20% | 18% | 19% | 19% | 19% | 20% | 21% | 21% |
| B: CTNM | 62% | 61% | 60% | 58% | 59% | 56% | 54% | 52% | 49% | 46% | 44% |
| C: CTFA | 11% | 16% | 18% | 21% | 22% | 23% | 25% | 29% | 30% | 32% | 34% |
| D: Winding Up | 2% | 2% | 2% | 1% | 2% | 1% | 1% | 1% | 1% | 1% | 1% |
| Total | 100% | 100% | 100% | 100% | 100% | 100% | 100% | 100% | 100% | 100% | 100% |
Table 4: Number of memberships by status and membership type
| Status | Active | Deferred | Pensioner |
|---|---|---|---|
| A: Open | 566,829 | 806,502 | 685,446 |
| B: CTNM | 218,915 | 2,027,418 | 2,050,857 |
| C: CTFA | 0 | 1,875,994 | 1,492,120 |
| D: Winding Up | 0 | 33,901 | 38,456 |
| Total | 785,744 | 4,743,815 | 4,266,879 |
Membership by size
Table 5: Number of memberships by membership group and membership type
| Membership group | Active | Deferred | Pensioner |
|---|---|---|---|
| A: 2 - 99 | 3,527 | 37,532 | 44,718 |
| B: 100 - 999 | 32,690 | 395,840 | 366,239 |
| C: 1,000 - 4,999 | 94,124 | 790,592 | 713,694 |
| D: 5,000 - 9,999 | 88,541 | 508,693 | 488,107 |
| E: 10,000 + | 566,862 | 3,011,158 | 2,654,121 |
| Total | 785,744 | 4,743,815 | 4,266,879 |
Membership by year
Figure 5: Memberships by type and year
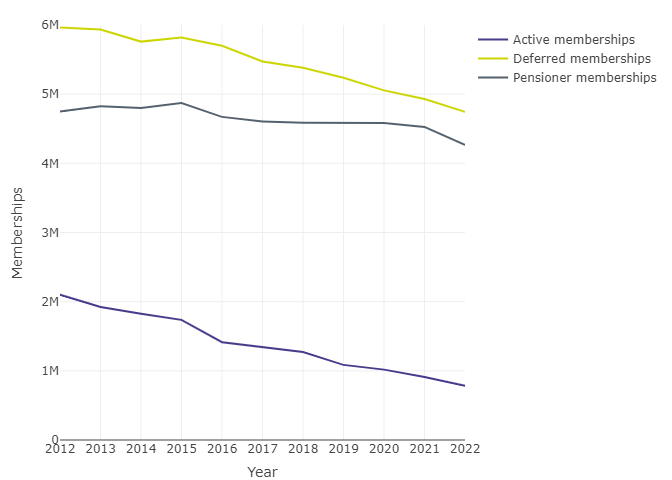
Figure 5 data: Data underlying Figure 5, pertaining to the number of memberships by type and year
| Year | Active memberships | Deferred memberships | Pensioner memberships |
|---|---|---|---|
| 2012 | 2,098,832 | 5,962,746 | 4,747,805 |
| 2013 | 1,923,447 | 5,934,726 | 4,826,893 |
| 2014 | 1,825,739 | 5,759,914 | 4,799,853 |
| 2015 | 1,736,782 | 5,819,924 | 4,872,638 |
| 2016 | 1,414,492 | 5,700,747 | 4,671,850 |
| 2017 | 1,340,900 | 5,471,523 | 4,603,368 |
| 2018 | 1,272,282 | 5,383,346 | 4,585,165 |
| 2019 | 1,086,733 | 5,236,325 | 4,588,475 |
| 2020 | 1,017,211 | 5,054,710 | 4,582,563 |
| 2021 | 909,502 | 4,929,601 | 4,526,214 |
| 2022 | 785,744 | 4,743,815 | 4,266,879 |
Schemes and memberships by principal employer type
Table 6: Proportion of schemes by status and principal employer type (% by status)
| Principal employer type | A: Open | B: CTNM | C: CTFA | D: Winding up | Total |
|---|---|---|---|---|---|
| College or education institution | 32% | 30% | 34% | 4% | 100% |
| Government / public body | 18% | 27% | 55% | 0% | 100% |
| Limited liability partnership | 0% | 30% | 69% | 2% | 100% |
| Other | 13% | 40% | 45% | 2% | 100% |
| Overseas Company | 0% | 34% | 61% | 5% | 100% |
| Partnership | 0% | 48% | 48% | 3% | 100% |
| Private limited company | 5% | 36% | 57% | 2% | 100% |
| Public limited company | 5% | 41% | 52% | 2% | 100% |
| Registered charity | 5% | 38% | 56% | 2% | 100% |
| Sole trader | 0% | 50% | 50% | 0% | 100% |
Table 7: Proportion of memberships by status and principal employer type (% by status)
| Principal employer type | A: Open | B: CTNM | C: CTFA | D: Winding up | Total |
|---|---|---|---|---|---|
| College or education institution | 75% | 18% | 6% | 0% | 100% |
| Government / public body | 4% | 7% | 90% | 0% | 100% |
| Limited liability partnership | 0% | 32% | 59% | 8% | 100% |
| Other | 16% | 51% | 33% | 0% | 100% |
| Overseas Company | 0% | 14% | 69% | 18% | 100% |
| Partnership | 0% | 50% | 49% | 0% | 100% |
| Private limited company | 19% | 40% | 40% | 1% | 100% |
| Public limited company | 11% | 47% | 41% | 1% | 100% |
| Registered charity | 24% | 36% | 40% | 0% | 100% |
| Sole trader | 0% | 84% | 16% | 0% | 100% |
Table 8: Proportion of schemes by principal employer type and status (% by employer type)
| Principal employer type | A: Open | B: CTNM | C: CTFA | D: Winding up |
|---|---|---|---|---|
| College or education institution | 6% | 1% | 1% | 2% |
| Government / public body | 1% | 0% | 0% | 0% |
| Limited liability partnership | 0% | 1% | 2% | 1% |
| Other | 23% | 11% | 8% | 10% |
| Overseas Company | 0% | 1% | 1% | 2% |
| Partnership | 0% | 1% | 1% | 1% |
| Private limited company | 58% | 70% | 74% | 72% |
| Public limited company | 7% | 10% | 8% | 7% |
| Registered charity | 4% | 6% | 6% | 4% |
| Sole trader | 0% | 0% | 0% | 0% |
| Total | 100% | 100% | 100% | 100% |
Table 9: Proportion of memberships by principal employer type and status (% by employer type)
| Principal employer type | A: Open | B: CTNM | C: CTFA | D: Winding up |
|---|---|---|---|---|
| College or education institution | 10% | 1% | 0% | 0% |
| Government / public body | 0% | 0% | 1% | 0% |
| Limited liability partnership | 0% | 1% | 1% | 7% |
| Other | 8% | 10% | 7% | 5% |
| Overseas Company | 0% | 0% | 0% | 5% |
| Partnership | 0% | 0% | 0% | 0% |
| Private limited company | 57% | 49% | 53% | 48% |
| Public limited company | 22% | 37% | 35% | 34% |
| Registered charity | 3% | 2% | 2% | 1% |
| Sole trader | 0% | 0% | 0% | 0% |
| Total | 100% | 100% | 100% | 100% |
Part 3 funding
Figure 6: Estimated Part 3 funding figures as of 31 March 2022 for schemes in surplus and deficit by scheme status (excludes schemes winding up)
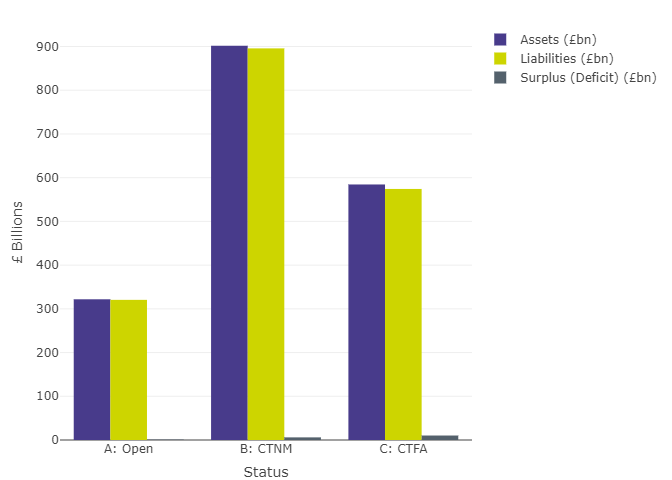
Figure 6 data: Data underlying figure 6, pertaining to Part 3 funding figures by scheme status
| Status | Assets (£bn) | Part3 Liabilities (£bn) | Surplus (Deficit) (£bn) |
|---|---|---|---|
| A: Open | 321.84 | 320.536 | 1.304 |
| B: CTNM | 901.746 | 895.727 | 6.019 |
| C: CTFA | 584.455 | 574.205 | 10.251 |
Table 10: Estimated funding figures as of 31 March 2022 for schemes in deficit by status (excludes schemes winding up)
| Status | Assets (£bn) | Part 3 Liabilities (£bn) | Surplus (Deficit) (£bn) |
|---|---|---|---|
| A: Open | 152.485 | 165.185 | -12.699 |
| B: CTNM | 422.984 | 453.815 | -30.83 |
| C: CTFA | 194.716 | 213.797 | -19.08 |
| Total | 770.186 | 832.796 | -62.61 |
Table 11: Estimated funding figures as of 31 March 2022 for schemes in surplus by status (excludes schemes winding up)
| Status | Assets (£bn) | Part 3 Liabilities (£bn) | Surplus (Deficit) (£bn) |
|---|---|---|---|
| A: Open | 169.355 | 155.351 | 14.004 |
| B: CTNM | 478.762 | 441.912 | 36.849 |
| C: CTFA | 389.739 | 360.408 | 29.331 |
| Total | 1,037.86 | 957.671 | 80.184 |
Table 12: Number of schemes by estimated funding level as of 31 March 2022 and status (excludes schemes winding up)
| Status | Less than 60% | 60% to less than 80% | 80% to less than 100% | 100% or greater |
|---|---|---|---|---|
| A: Open | 1 | 35 | 157 | 294 |
| B: CTNM | 32 | 115 | 783 | 1,031 |
| C: CTFA | 52 | 287 | 1,096 | 1,240 |
| Total | 85 | 437 | 2,036 | 2,565 |
Figure 7: Estimated Part 3 funding figures as of 31 March 2022 by membership group (excludes schemes winding up)
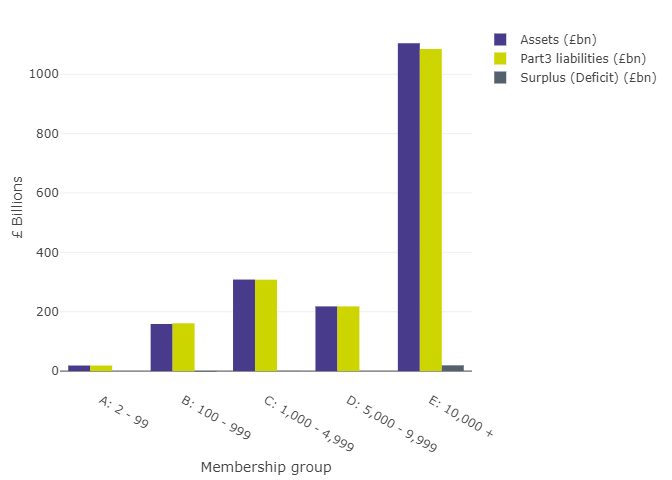
Figure 7 data: Data underlying figure 7, pertaining to Part 3 funding figures by membership group
| Membership group | Assets (£bn) | Part3 Liabilities (£bn) | Surplus (Deficit) (£bn) |
|---|---|---|---|
| A: 2 - 99 | 18.687 | 18.688 | -0.001 |
| B: 100 - 999 | 158.646 | 160.914 | -2.268 |
| C: 1,000 - 4,999 | 308.348 | 307.838 | 0.511 |
| D: 5,000 - 9,999 | 217.918 | 217.925 | -0.006 |
| E: 10,000 + | 1,104.44 | 1,085.10 | 19.339 |
Table 13: Number of schemes by membership group and estimated funding level group as of 31 March 2022 (excludes schemes winding up)
| Membership group | Less than 60% | 60% to less than 80% | 80% to less than 100% | 100% or greater |
|---|---|---|---|---|
| A: 2 - 99 | 44 | 170 | 695 | 961 |
| B: 100 - 999 | 34 | 208 | 912 | 1,074 |
| C: 1,000 - 4,999 | 6 | 42 | 303 | 345 |
| D: 5,000 - 9,999 | 1 | 10 | 67 | 76 |
| E: 10,000 + | 0 | 7 | 59 | 109 |
| Total | 85 | 437 | 2,036 | 2,565 |
Public service defined benefit schemes
Figure 8: Balance of membership types in public service schemes
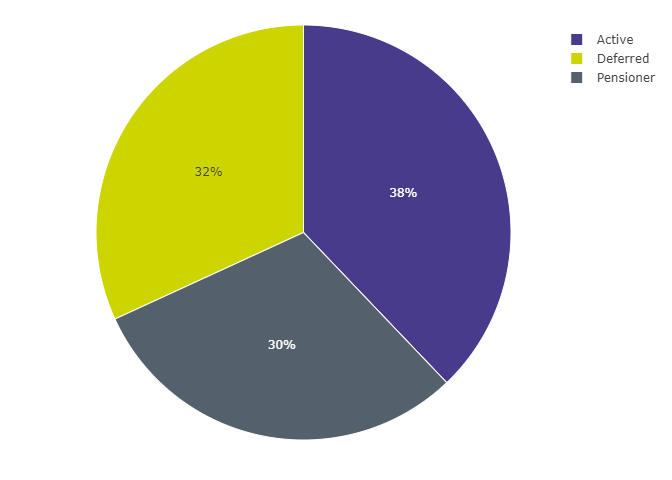
Figure 8 data: Data underlying Figure 8, pertaining to the balance of membership types in public service schemes
| Membership Type | Memberships |
|---|---|
| Active | 6,812,460 |
| Deferred | 5,729,055 |
| Pensioner | 5,445,530 |
Figure 9: Comparison of balance of membership types – public service and private DB / hybrid
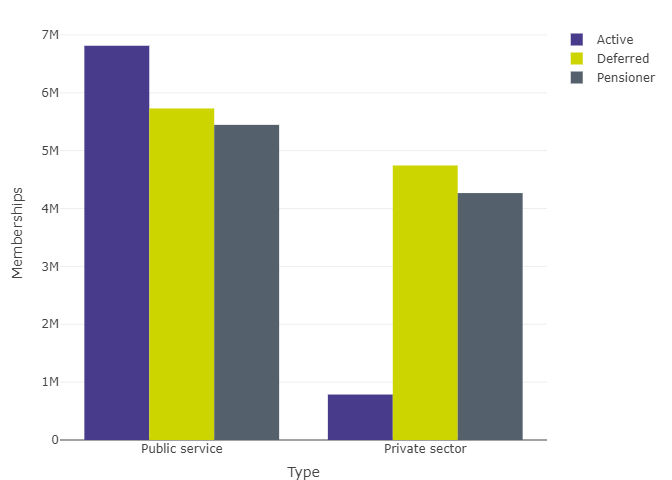
Figure 9 data: Data underlying Figure 9, pertaining to the balance of membership types in public service schemes
| Type | Active | Deferred | Pensioner |
|---|---|---|---|
| Public service | 6,812,460 |
5,729,055 |
5,445,530 |
| Private sector | 785,744 |
4,743,815 |
4,266,879 |
Glossary
Accrual
Accrual is the build-up of an active scheme member’s pension benefits or entitlements in a DB pension scheme.
Active members
In a DB scheme these are members of the scheme who are current employees and accruing benefits.
Actuarial or funding valuation
A comparison by the actuary of the value placed on scheme assets with the TPs and an assessment of any future contribution requirement. Calculation of the TPs is usually based on full member-by-member data.
Deferred members
Deferred members are members of pension schemes who have accrued rights to pensions that will come into payment in the future but who are no longer accruing benefits in the scheme. Also known as members with preserved pension entitlements.
Defined benefit (DB)
A defined benefit (DB) pension is one in which the rules of the scheme specify the rate of benefits to be paid. The most common DB scheme is a final salary scheme in which the benefits are based on the number of years of pensionable service, the accrual rate and the final salary. An alternative to the final salary scheme is the Career Average Revalued Earnings (CARE) scheme, which is also a DB scheme.
Effective date (valuation date)
An actuarial valuation or an actuarial report considers the funding of a scheme as at a particular date, known as the effective date. The effective date will be earlier than the date on which calculations are done. The effective date of a scheme’s first Part 3 valuation cannot be before 22 September 2005.
Funded (or unfunded) scheme
A funded scheme is one in which benefits are met from a fund built up in advance from contributions and investment income. Such schemes have assets, even if these are not sufficient to meet all their liabilities, by contrast with unfunded schemes, in which liabilities are not underpinned by assets.
Hybrid scheme
A hybrid scheme is an occupational pension scheme where members have either a choice, or mixture, of DB and DC pension entitlements. In a ‘pure’ hybrid arrangement, members receive benefits that are a mixture of DB and DC. In a ‘mixed hybrid’ scheme, there are separate DB and DC groups of members (often organised in separate sections of the scheme).
Occupational pension schemes
An occupational pension scheme is an arrangement (other than accident or permanent health insurance) organised by an employer (or on behalf of a group of employers) to provide benefits for employees on their retirement and for their dependants on their death. They are a form of workplace pension. Occupational pension schemes for private sector employees are also referred to as trust-based schemes.
Part 3 valuation or scheme funding valuation
An actuarial valuation meeting the requirements of Part 3 of the Pensions Act 2004 concerning the funding of DB pension liabilities, which apply to any actuarial valuation received by trustees (on or after 30 December 2005) that is based on an effective date of 22 September 2005 or later.
Pensioner members
Pensioner members are members of pension schemes who are receiving pensions or income withdrawals, sometimes known as beneficiaries.
Pension Protection Fund (PPF)
A corporate body established under the Pensions Act 2004. The PPF was set up to provide compensation to members of eligible DB pension schemes, when there is a qualifying failure event in relation to the employer, and where there are insufficient assets in the pension scheme to cover the PPF level of compensation.
Public service pension schemes
These are pension schemes within the meaning defined in Section 318 of the Pensions Act 2004. These are schemes established under the Public Service Pensions Act 2013 Act, new public body pension schemes and other statutory pension schemes which are connected to those schemes. It does not apply to schemes in the wider public sector, nor to any scheme which is excluded from being a public service pension scheme within the meaning of the Pensions Act 2004. Substantially, these are the schemes providing pension benefits for civil servants, the judiciary, local government workers, teachers, health service workers, fire and rescue workers, members of police forces and the armed forces.
Technical provisions [liabilities] (TPs)
The liabilities or funding measure used for the purposes of Part 3 valuations (see above). The ‘TPs’ are a calculation undertaken by the actuary of the assets needed at any particular time to make provision for benefits already considered accrued under the scheme using assumptions prudently chosen by the trustees – in other words, what is required for the scheme to meet the statutory funding objective. These include pensions in payment (including those payable to survivors of former members) and benefits accrued by other members and beneficiaries, which will become payable in the future.
The Pensions Regulator (TPR)
A corporate body established under the Pensions Act 2004. The UK regulator of work-based pension schemes, a non-departmental public body established under the Pensions Act 2004.
Appendix
Appendix 1: Percentage of memberships in data set absent from the Purple Book, by status
| % of memberships | Open | CTNM | CTFA | Winding up |
|---|---|---|---|---|
| In Purple Book | 20.9 | 37.8 | 33.5 | 0.3 |
| Not in Purple Book | 0.1 | 6.1 | 0.9 | 0.4 |
Appendix 2: Percentage of assets in data set absent from the Purple Book, by status
| % of assets | Open | CTNM | CTFA |
|---|---|---|---|
| In Purple Book | 17.7 | 48.2 | 31.8 |
| Not in Purple Book | 0.1 | 1.6 | 0.5 |